Rate Limiting Troubleshooting
Overview
Troubleshooting rate limiting issues can be complicated, particularly as requests can be throttled at different layers of our stack. This page provides GitLab team members (who have the correct permissions) steps to follow in order to find where a customer’s request has been rate limited, and why.
Has a request been rate limited?
Rate limited requests will return a 429 - Too Many Requests response.
Following these troubleshooting guides for other status codes may still be beneficial.
What layer is rate limiting the request?
All traffic to GitLab.com is subject to rate limiting, there are different limits applied at Cloudflare and within the Application.
Note: If you are troubleshooting rate limiting issues for GitLab Pages or Registry, see other rate limits for details on how these are configured.
The following diagram should aid you in determining where to look first, and for further detail scroll down to the related section.
flowchart TD

    http[HTTP request] --> 429
    429[Was there a 429 response?]

    not-limited[The request was likely not rate limited]
    header[Does the response contain RateLimit-* Headers?]

    subgraph Cloudflare
        c-status[Filter the Cloudflare Dashboard by status code]
        c-http[Did you find the request in the Cloudflare Dashboard?]
    end

    subgraph Application
        r-logs[Did you find the request in the RackAttack logs?]
        a-logs[Did you find the request in the ApplicationRateLimiter logs?]
        w-logs[Did you find the request in the workhorse logs?]
    end

    yay[You hopefully found what you were looking for!]
    sre[Request SRE help]

    429 -- no --> not-limited
    429 -- yes --> header

    not-limited --> c-status

    header -- no --> c-http
    header -- not sure --> c-http
    header -- yes --> r-logs

    c-status --> yay
    c-http -- yes --> yay
    r-logs -- yes --> yay
    a-logs -- yes --> yay

    c-http -- no --> r-logs
    r-logs -- no --> a-logs
    a-logs -- no --> w-logs

    w-logs -- no --> sre
    yay -- still require assistance?--> sre
Rate Limit Response Headers
Sometimes users will see RateLimit-* response headers when a request has been rate limited;
this depends on the layer that has throttled the request.
For example, Cloudflare does not return a RateLimit-* response header.
This behaviour is better documented in the Rate Limiting Headers section of the handbook.
The presence (or absence) of these headers can be used to signal where to start your investigation,
as the RackAttack rate limits configured in the Application return these response headers on throttled requests.
Cloudflare
GitLab team members with access can use SSO to login to our Cloudflare account.
To do so, enter your GitLab email and the Log in with SSO option will appear.
To request access, open an access request for the Cloudflare Analytics role.
Watch a recorded walkthrough of the Cloudflare Dashboard (private to GitLab Team Members).
Quick Links
- Cloudflare Overview: gitlab.com domain
- Analytics & Logs: Network Analytics
- Analytics & Logs: HTTP Traffic for gitlab.com
- Security Center: Events for gitlab.com
- Security: Bot Analytics for gitlab.com
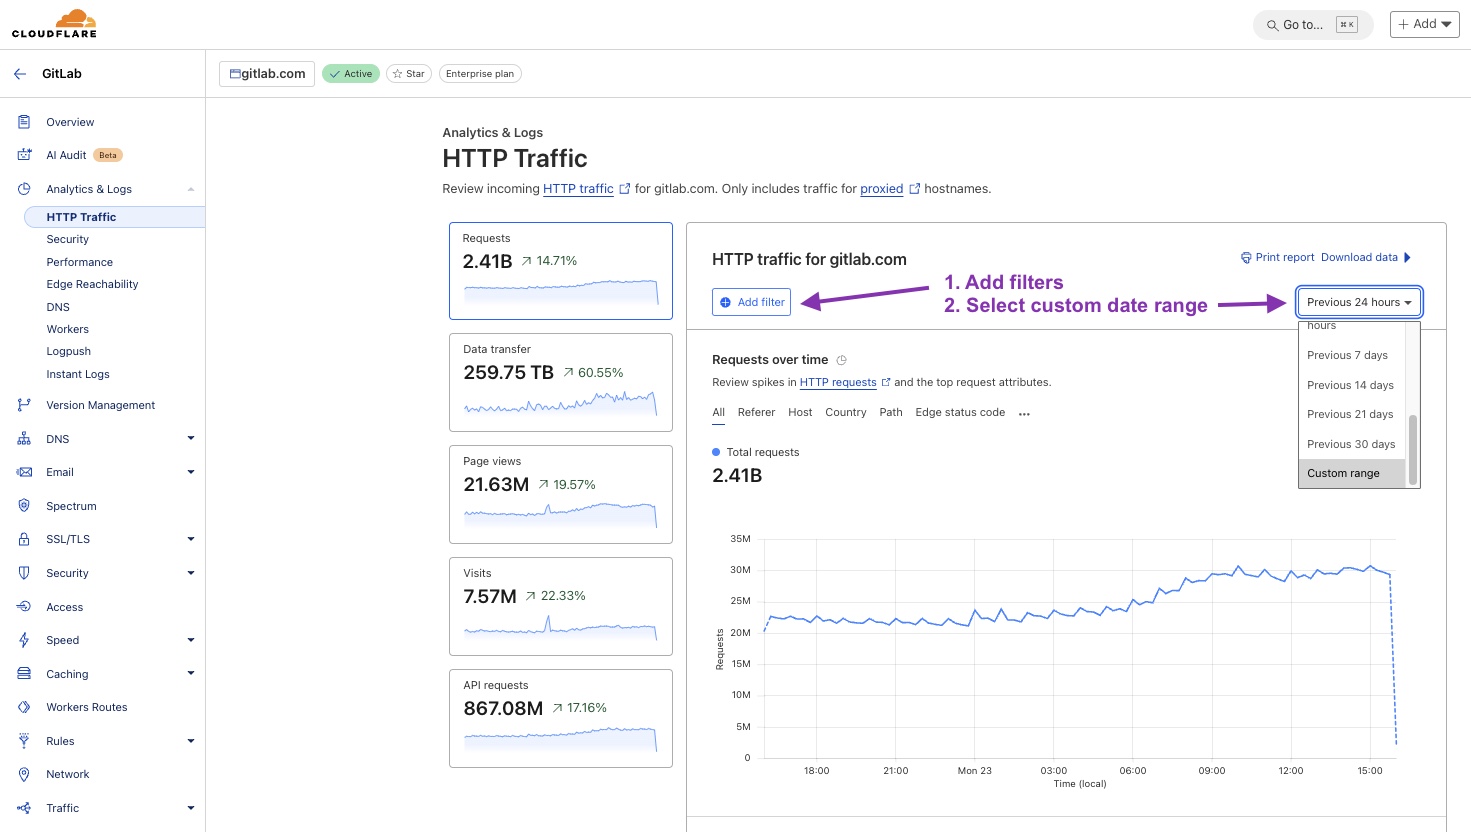
Select custom date ranges for your searches
Doing so serves two purposes:
- It narrows your search to a specific time period.
- It allows you to share a snapshot view with colleagues,
whereas the
Previous 24 hourswill generate a link with a rolling window.
Note: that the dates seen in the UI are in your local time zone.
HTTP Traffic Analytics
This dashboard will show the HTTP traffic for gitlab.com,
which can return sampled results.
Use this dashboard to look up paths, IPs, source user agents, data centers, and more.
Click to see Cloudflare HTTP Traffic Analytics

Add filters
There are a number of filters that can be applied when looking at HTTP traffic. A few useful filters to be aware of:
Source IP- filter by the customer’s IP address.Edge status code- this is the response code from Cloudflare.Origin status code- this is the response code from GitLab.
For example, seeing that the Edge status is different to the Origin status returned from GitLab could be an indication that a request isn’t making it past Cloudflare.
You can apply as many filters as required, then scroll down to see the results. The default view will return the top 5 items, but this can be increased to 15 items if required.
Security Events
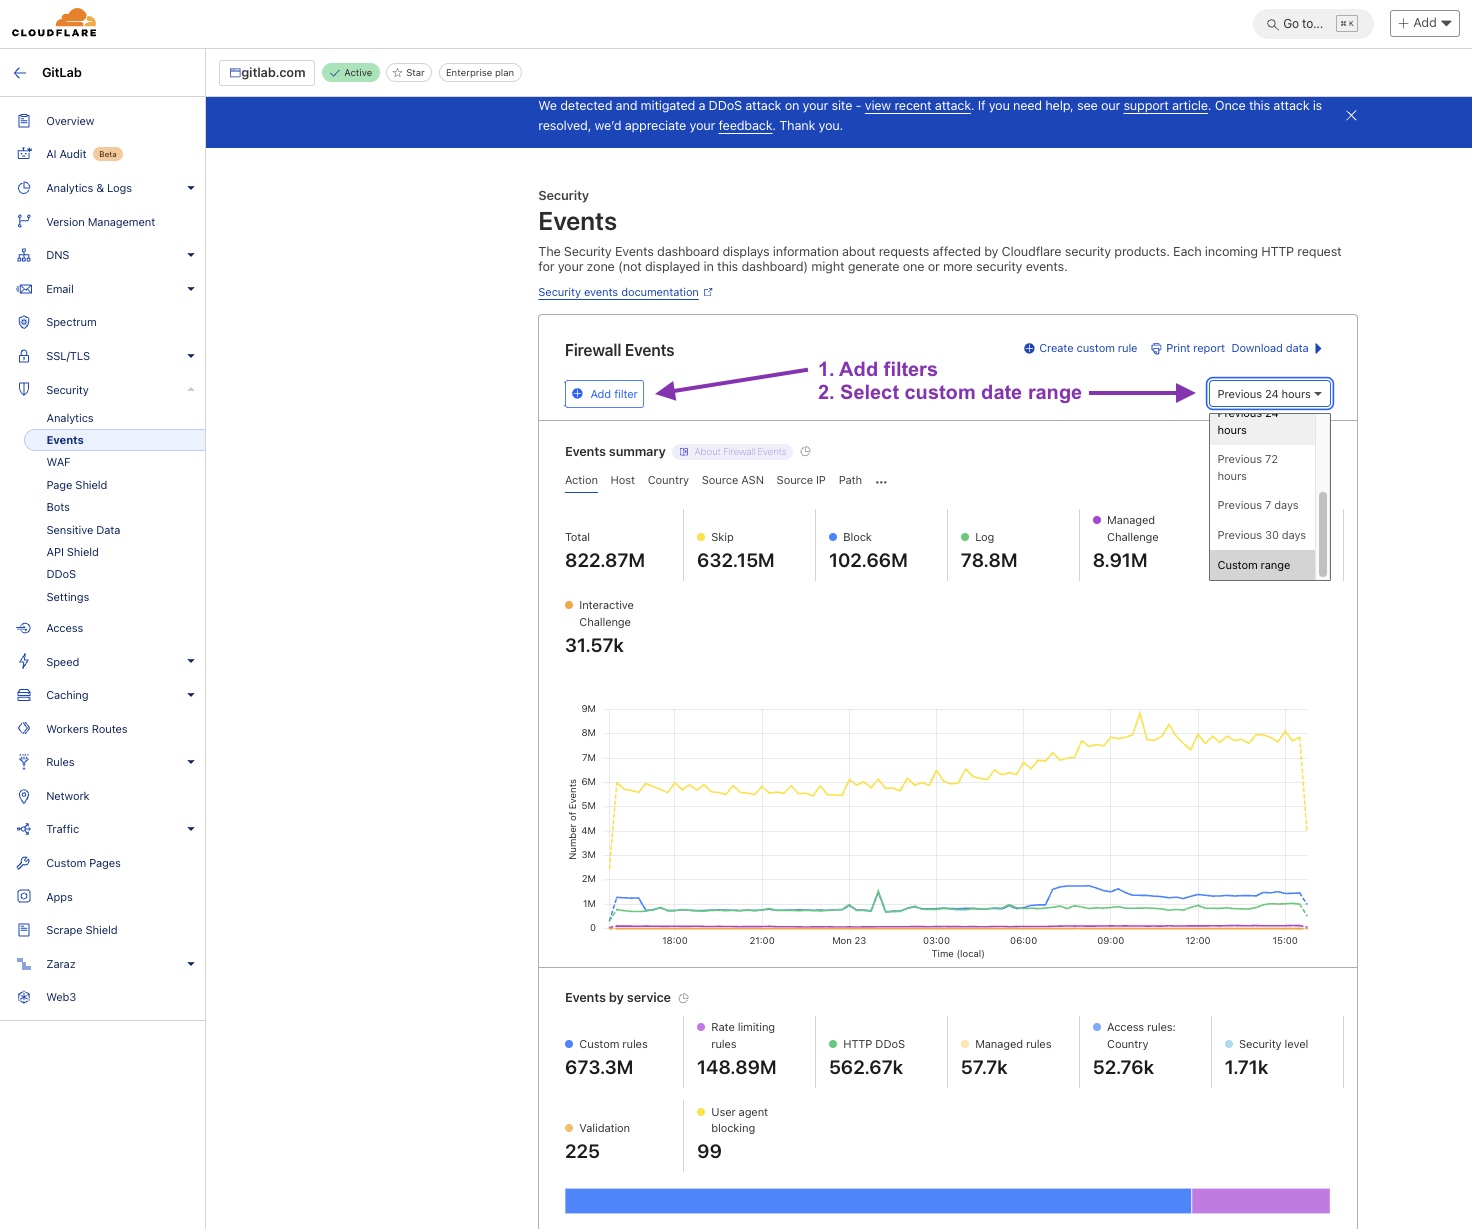
The Security Events show the volume of requests that were blocked, challenged, or skipped. Use this dashboard to investigate if (and what) Cloudflare rule might be blocking traffic.
Click to see Cloudflare Security Events

Add filters
The most useful filters you can apply when looking at Security Events are:
Source IP- filter by the customer’s IP address.Action- search for allowed, blocked, challenged, or other statuses.Ray ID- search for a specific identifier [Cloudflare Ray ID docs].
You can apply as many filters as required, then scroll down to see the results. The default view will return the top 5 items, but this can be increased to 15 items if required.
Note: Search results may be limited to 30 days.
Interpreting Results
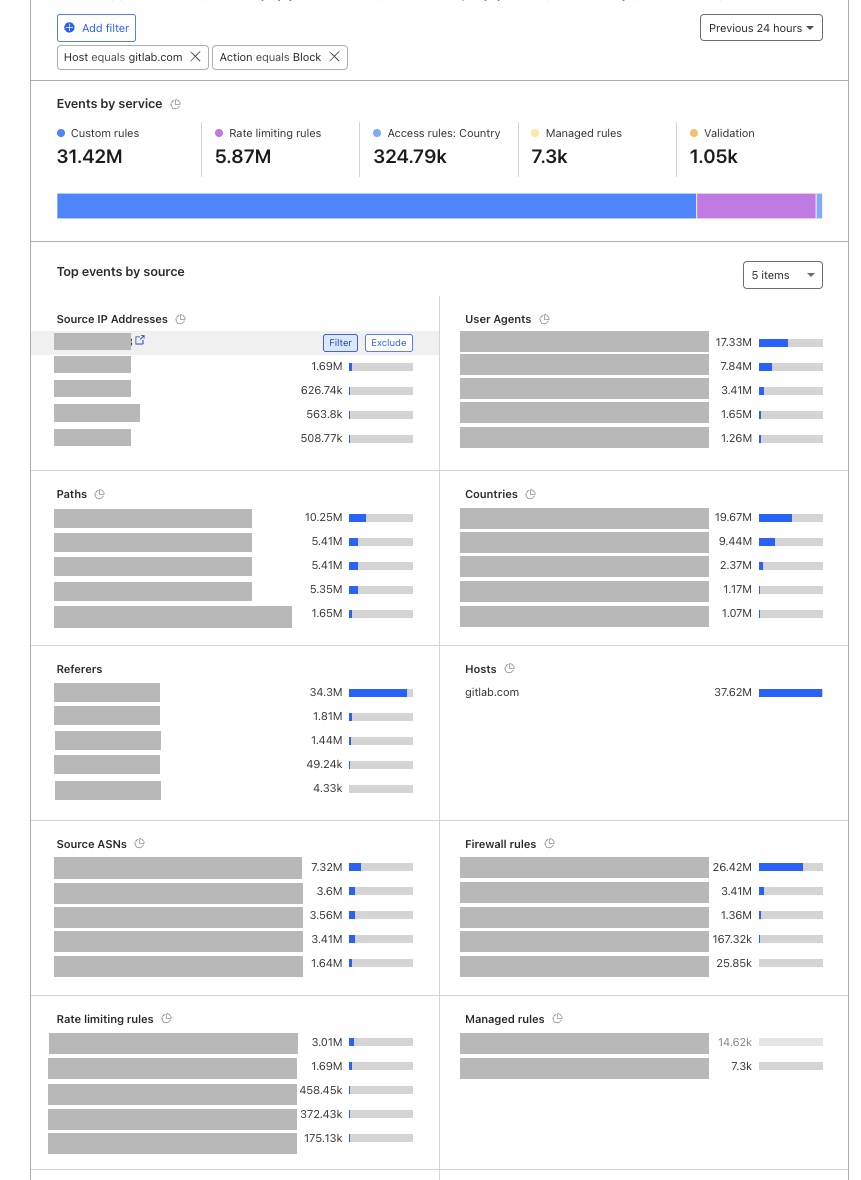
Once you have filtered your results then you can use the results to further investigate:
- Source IP Addresses: Are requests coming from one, or many IP addresses?
- User Agents: Are requests from a common library? What version?
- Paths: What resources or paths are they targetting, is there a pattern?
- Firewall/ Rate limiting/ Managed rules: What rules are being hit? Is this expected behaviour?
- Note: these may show as
Rule unavailableto those with Analytics access, but can still be beneficial to know which type of rule has blocked a request.
- Note: these may show as
If any of the results are particularly interesting,
you can hover over the value to further Filter or Exclude to dig deeper into your investigation.
Click to see Cloudflare Security Event Results
The below results have been redacted to remove any potentially sensitive information.

SSH Traffic
The Network Analytics dashboard allows you to filter by destination port.
Setting a filter of Destination port equals 22
will allow you to do basic analysis on SSH traffic.
For more detailed investigation, logs are pushed to a Google Cloud Storage (GCS) bucket where those with access to GCP can investigate further.
See the Cloudflare runbook for details on querying the Cloudflare logs, or follow guidance to request further SRE assistance.
Bots
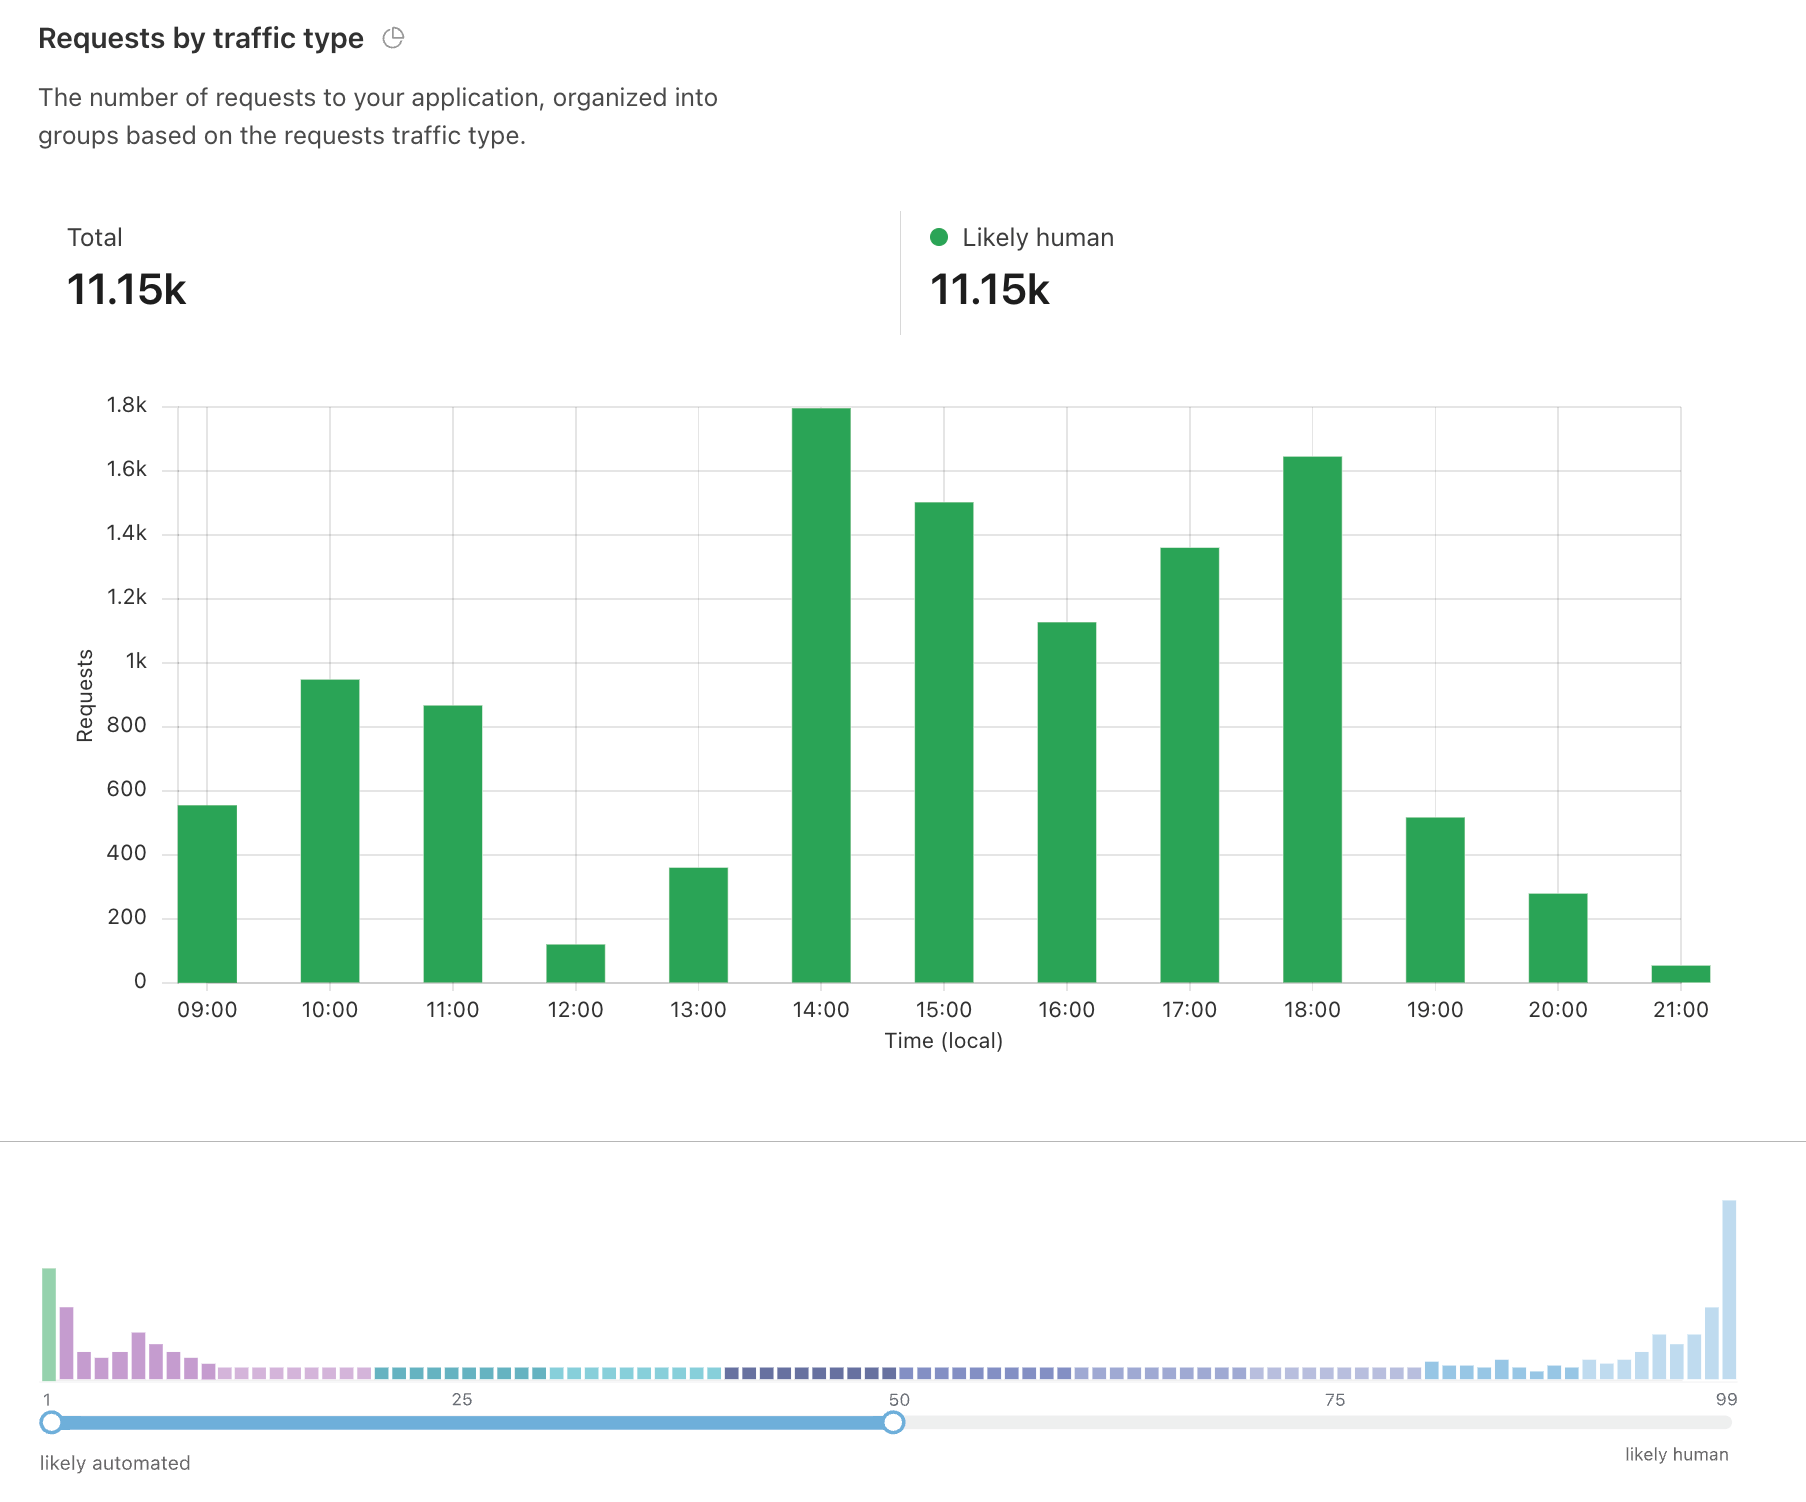
The Bot Analytics dashboard (Administrator access only) allows you to filter in the same way as other Cloudflare dashboards, which can be useful if all other options have been exhausted to determine the likelihood of automation versus human requests.
Click to see Cloudflare Bot Analytics

HAProxy
HAProxy is not used to throttle requests to gitlab.com,
however if you’re investigating rate limits related to Registry or Pages,
then you can refer to the HAProxy Logging runbook.
Application
There are two main throttling mechanisms in the GitLab Application: RackAttack and the ApplicationRateLimiter.
You can observe trends for both using the Rate Limiting Overview Grafana dashboard.
Quick Links
- Metrics: Rate Limiting Overview dashboard
- Logs: RackAttack
- Logs: ApplicationRateLimiter
- Logs: Rate Limit Dashboard
RackAttack
If a request is throttled by RackAttack it will contain RateLimit-* response headers.
You can filter the RackAttack logs by:
- IP address using
json.remote_ip - Throttle using
json.matched - Path using
json.path
ApplicationRateLimiter
You can filter the ApplicationRateLimiter logs by:
- IP using
json.meta.remote_ip - User using
json.meta.userorjson.meta.client_id - Project using
json.meta.project - Throttle using
json.env - Path using
json.path
Workhorse
If you have not found the request in Cloudflare, RackAttack, or ApplicationRateLimiter, then you can search for rate limited responses in the Workhorse logs by:
- IP using
json.remote_ip - Path using
json.uri - Status using
json.status
Requesting further assistance
If you have followed this troubleshooting guidance and have not found the results you were looking for, you can request further assistance from a Site Reliability Engineer (SRE) using one of two confidential issue templates:
Additional Resources
- Support Workflows: IP Blocks
- Runbooks: Rate Limiting
- Runbooks: Cloudflare
- Docs: RackAttack Troubleshooting
3dbdc15d)
