Product Analytics for UX Research
This page aims to serve as a resource for team members interested in leveraging data we collect about GitLab usage in order to perform or inform user experience research. It provides background information on what GitLab’s internal structures are, what data is available and where, and some best practices and tips to help team members get started.
While the information here is meant as a shortcut for people doing UX Research, it only scratches the surface of GitLab’s capabilities with data. For more in-depth information, see the Data team’s handbook.
Understanding the Product Analytics Landscape
To efficiently get to the usage data you need to conduct research, it’s important to understand the various tools and teams involved in data and analytics at GitLab.
Tools
In order of most to least relevant to UX Researchers:
- Tableau - the business intelligence analytics tool we use as a ‘frontend’ to analyze and visualize data from Snowflake and Service Ping.
- Snowflake - a cloud-based data warehousing platform primarily used for storing and analyzing structured data (i.e., the thing that stores the event data).
- Service Ping - an event tracking tool GitLab built to perform event tracking on self-managed instances (i.e., the thing that tracks events on GitLab self managed).
- Snowplow - an open-source event tracking platform used for collecting, processing, and enriching event-level data from various sources (i.e., the thing that tracks the events on GitLab.com).
Useful Links
- Tableau workbooks (A list of workbooks UX Researchers have found useful)
- Tableau handbook page (The GitLab handbook page on Tableau)
- Analytics relevant to each product stage (A GitLab handbook page for product stage resources)
- GitLab Metrics Dictionary (A website listing all the metrics we collect from Service Ping and Snowplow)
- Data Catalog (Internal handbook page with examples of commonly used data models)
- DBT (Explains the underlying code and column definitions of all GitLab data sets)
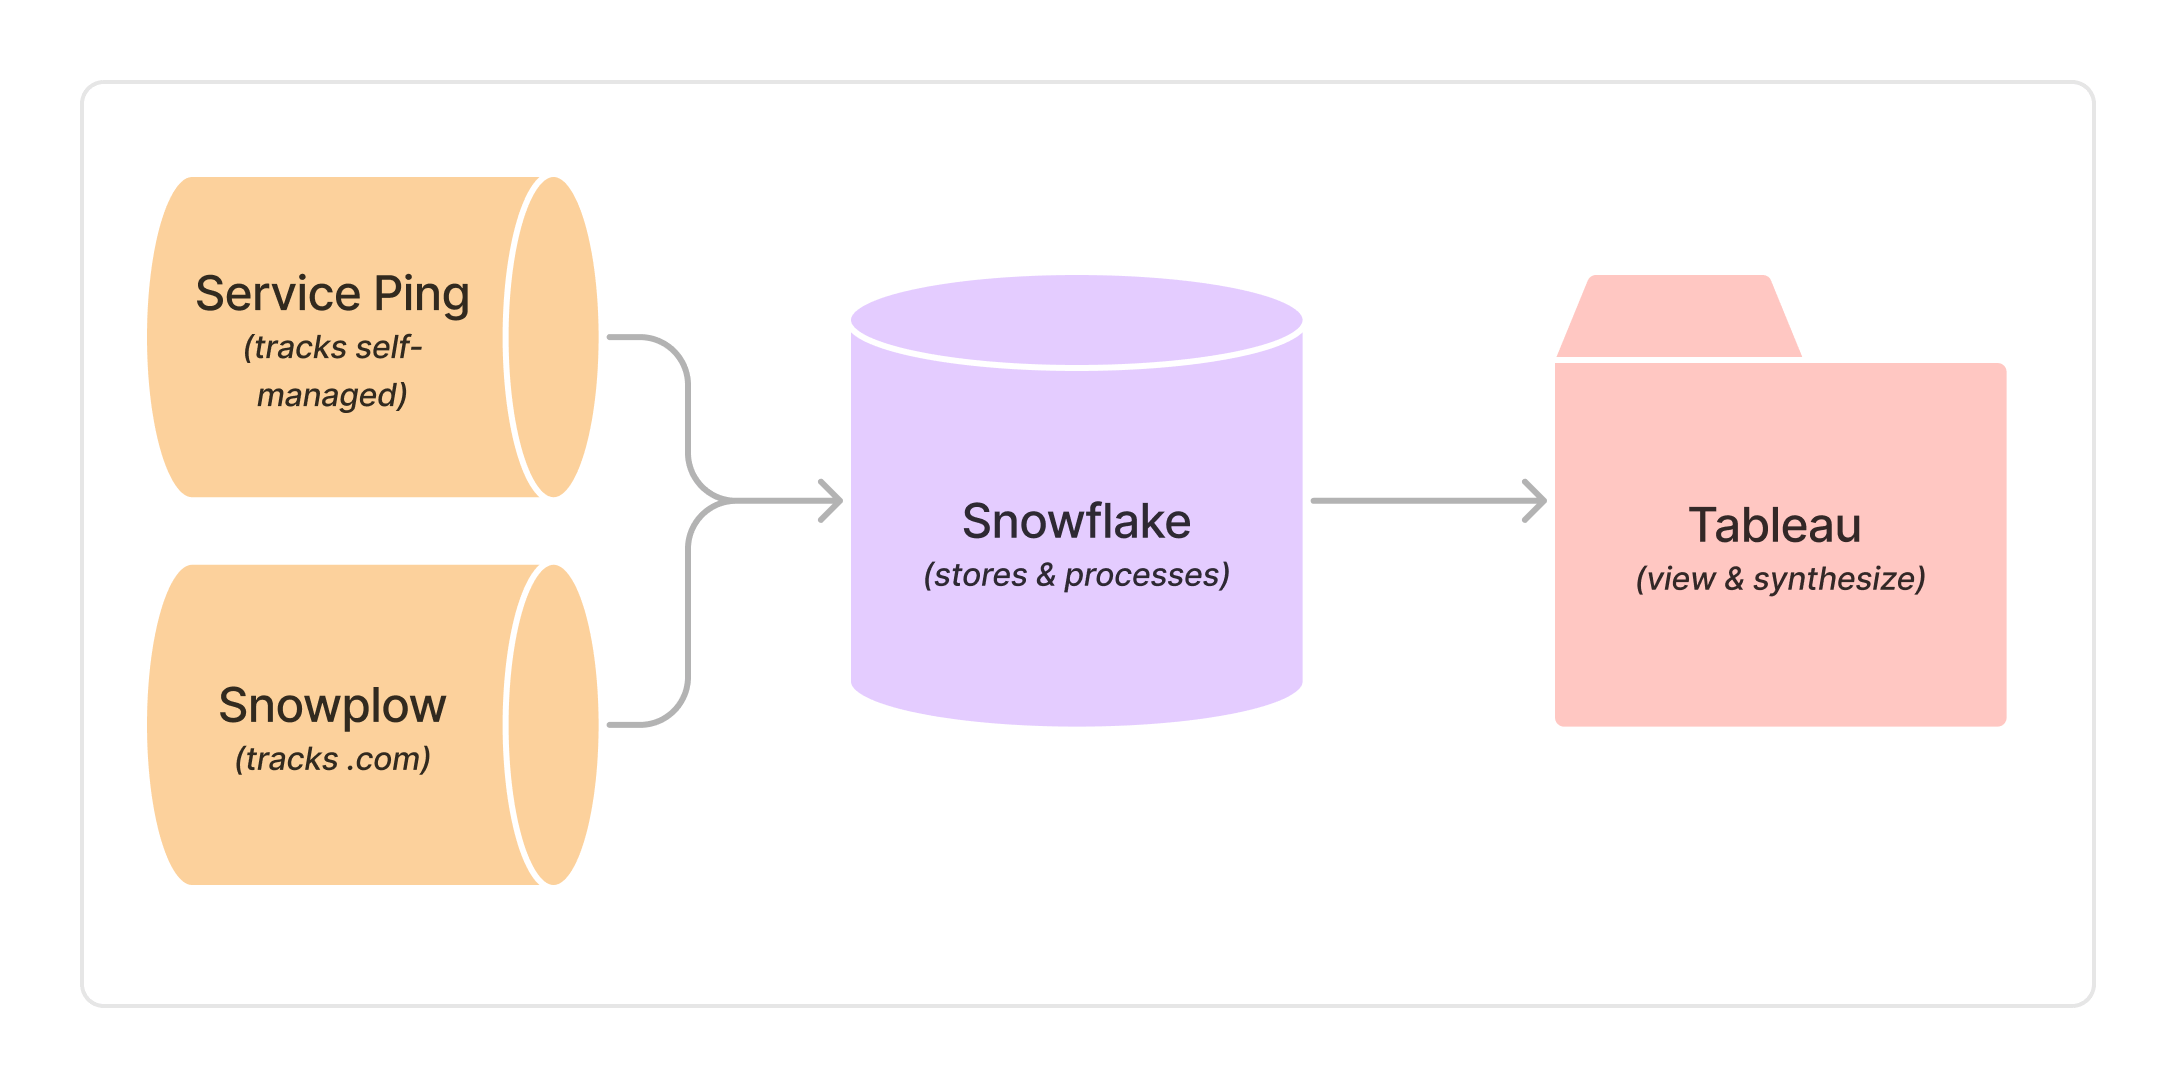 The above illustration shows a simplified version of GitLab’s usage data stack, based on this document.
Getting Access
Complete an access request to use Tableau. Some UX Researchers have Explorer roles, and some have Viewer roles - if you want to see the differences in capabilities between the two roles, check this handbook page.
To view some dashboards and data, you will need SAFE access, but others are available without. If you do find yourself unable to access information you need, complete a SAFE-related access request for Tableau.
NOTE: Obtaining SAFE access to user data will put you on the designated insiders list, which will require you to obtain pre-clearance in order to sell any GitLab shares you own, as well as restrict the trading window in which you can do so.
Teams to collaborate with
There’s a more complete explanation of the various groups that are responsible for data at GitLab, but here are two teams you’ll want to know about if you’re performing UX Research.
Product Data Insights (PDI) – As the name suggests, this team is responsible for helping folks in Product use data to gain insights. Typically, there is a team member assigned to your area of the product (find your partner on the product data insights team here). The Product Data Insights team can take requests (via an issue) for certain kinds of analysis, they can help you find the data you’re looking for and are generally a great resource for asking questions during Office Hours or over Slack. They are well-versed in Tableau.
Analytics Instrumentation - This group is focused on building out the instrumentation capabilities of GitLab and its team members, including increased instrumentation coverage across the product and scaling the instrumentation system we use to handle more use cases. This is a group to contact if you run into a block where something you want to do isn’t currently available (or you’re not sure and the Product Data Insights team doesn’t know).
The Analytics Instrumentation team members are the DRIs for data collection across both GitLab.com and Self-Managed. They own Service Ping and Snowplow. They are the ones to go to for questions like:
- How do I instrument a new statistic for self-managed?
- What are the best practices for adding to Service Ping?
- How can I use Snowplow to track a frontend interaction on GitLab.com?
- Can I utilize Snowplow to track events on the server-side?
The state of available information
GitLab has pledged to not use 3rd party software for telemetry, so we have built our own (Service Ping). Due to this and the rapid growth of the product, currently there are gaps in which parts of the product are instrumented for usage analytics and telemetry.
As mentioned above, the analytics instrumentation team has efforts underway to gain more coverage, ensure new features are instrumented before release, and to work on the backlog of non-instrumented features.
Is it possible to associate user level behavior in our GitLab.com data to our Snowplow events (i.e., can we track a single user’s behavior)? (Source)
No. Our Snowplow user identifiers are anonymized, while our GitLab.com user identifiers are not. However, it is possible to join Snowplow and GitLab.com data at the namespace (group/project) level (i.e., track more broadly).
Common metrics and segments that GitLab tracks
- Monthly active users (MAU)
- Examples: MAU per stage, per group, per section
- Performance indicators (PI)
- Examples: MAU, conversion rate, category maturity advancement
- User segments
- Examples: Geo Region, # of seats, industry vertical
- Product tiers
- Examples: Free, Premium, Ultimate
- Product sections:
- Examples: Analytics, CD, CI, Dev, Sec
- Delivery
- Examples: SaaS, Paid SaaS, Self-Managed
Working with Product Data Insights team
PDI How to work with us is a great resource on how to open up a product data insight request.
-
Get access to:
- The right tools (usually Tableau online is sufficient)
- The data (do you need SAFE access)
-
Determine the set of questions you’re trying to answer, including:
- Which user criteria / segment?
- Which metrics?
- Which components or features (if applicable)?
-
Check with your PM (and/or your PDI counterpart) to determine:
- Is this tracked today?
- This can be difficult to determine, try asking in #data or by working with your PM and PDI counterpart.
- If not, consider reaching out to the Analytics Instrumentation team or ask in #data.
- Is there a dashboard or analysis done already, or do you need a new chart or dashboard?
- Before opening a request, do a quick search to see if an analysis already exists. If you have trouble determining that, you can ask in #data.
- If new analysis is needed, open a PDI request. Alternatively, you can try to build out your own charts and dashboards, though based on past UXR experiences, partnering with PDI is a great way to get more familiar with Tableau and product usage data.
- Is this tracked today?
How can I get help?
- If you ever get stuck or have a question, please ask for help in the #data Slack channel.
- Attend the Product Data Insights team’s office hours.
- Tableau Training Videos
Example UXR-PDI use case
- Finding quantitative data to triangulate with qualitative research findings (e.g., prioritizing active, commonly used flows; understanding scale and scope of usage).
- How many (or what percent) of users (Monthly Active Users, MAU) did X action?
- How many (or what percent) of users went from point A to point B? (i.e., funnel analysis)
- How has usage of X action changed over time? (e.g., for adoption of a feature / since a change was introduced)
Simplified Metrics Glossary
Some terminology used in product analytics dashboards:
- AMAU - Action Monthly Active Users (Unique MAU which engaged with a specific feature)
- CMAU - Estimated Combined Monthly Active Users (Sum of SMAUs across all stages)
- GMAU - Group Monthly Active Users (Unique MAU using features within a specific group)
- SMAU - Stage Monthly Active Users (Unique MAU that used features within a stage)
- Section MAU - Section Monthly Active Users
- UMAU - Unique Monthly Active Users
- DAU/WAU - Daily/Weekly Active Users
- PI - Performance Indicator
- PPI - Primary Performance Indicator (some stages/groups may prefer a different metric than MAU)
- SpU - Stages per user
- SpO - Stages per organization
For more information (or if something’s not listed above):
Useful Tableau Workbooks
There are many dashboards available by searching around in Tableau. Here’s a list of a few that UX team members have created or found:
- A list of all dashboards created by the Product Data Insights team
- PDI Dashboards, Analysis, & Insights handbook page
- Firmographic Product Metric Usage Dashboard
- Centralized Product Usage Metrics Dashboard
- Customer Request Dashboard
- Subscription Feature Usage Trends
- UX KPIs
- Snowplow Event Exploration last 30 days
- Service Ping Metrics Exploration Dashboard
- GitLab.com Programming Languages
8a4a60ac)
