Qualtrics tips and tricks
Creating a survey
- Select
Blank survey project - Give your project a name.
- Enter survey questions. On the right hand side of the screen you will find:
- Question types and formatting (number of answer choices, positioning and so on).
- Validation (force respondents to answer a question or request that they consider answering the question before leaving the page).
- Actions (such as page breaks, skip logic and display logic).
- Update the
Look & Feelof your survey.- Please refer to Look & Feel settings for guidance.
- Adjust your Survey Options as appropriate.
- Under the Tools menu, you will find a host of useful features such as:
Collaborate- Allows you to share your survey with another Qualtrics user so you can edit it and/or analyze the results together.Spell check- Supports English (US) only.Generate test responses- Generate automated dummy responses for your survey to see what the dataset and report will look like before sending the survey to actual participants.Check survey accessibility- Determine whether your survey is accessible for respondents who use screen readers, and receive suggestions for improving your survey’s accessibility.Analyze Survey- Open ExpertReview’s suggestions for your survey.Import/export survey- From/to a QSF, TXT or DOC file.
- When you have finished building your survey,
Previewit to ensure that everything is working the way you expect it to. - Once you are ready to launch your survey, click
Publish.
Styling (Look & Feel settings)
The following settings should be applied to your survey:
- Theme: Blank
- Layout: Modern
- General
- Progress bar: Without Text
- Progress bar position: Top
- Style
- Primary colour: #554488
- Secondary colour: #554488
- Font: Arial
- Foreground contrast: Medium
- Question spacing: Compact
- Question text: 14px bold
- Answer text: 14px
- Motion
- Page transition: None
- Additional check boxes: Unticked
- Logo
- GitLab First Look Logo (stored in the UX Research & Product graphics library within Qualtrics)
- Style: Banner
- Placement: Left
- Max height: 70px
- Mobile scaling: 66%
- Background
- Background type: Color
- Background color: #ffffff
- Foreground contrast: Medium
- Questions container: Off
Avoiding spam responses from social media
Distributing a survey on social media is a great way to quickly expand your audience, reducing the time and cost of research. However, be aware that surveys shared on social media are often targeted by bots or fake participants to submit dozens or hundreds of responses in a short amount of time, affecting the integrity of the data. This especially affects surveys with rewards.
Some bots are more sophisticated than others. For example, basic bots will “speed” through the survey or provide illogical responses to open-ended questions; more sophisticated bots will intentionally take more time to complete the survey or even use language from the survey itself to compose logical responses to open-ended questions.
There are multiple things you can do to prevent or filter out most of these responses. We say “most of these responses” because the only true way to avoid spam in your surveys is to not share them on social media but rather to send email survey invitations with individual links that can only be used once, leveraging resources such as Marketo or the Data Warehouse to contact targeted sets of GitLab users we have on file.
Prevent spam responses before sharing the survey
Before sharing your survey, use the following approaches to prevent bots and fake participants. Note that while Qualtrics captcha question and fraud detection features help, they are insufficient in preventing more sophisticated bots.
- Add a captcha question at the beginning of the survey.
- Enable all fraud detection features: Prevent multiple submissions, Bot detection, Security scan monitor, and RelevantID.
- Add a “honeypot” question, a question hidden from humans but “visible” to bots. Some bots will answer this question, allowing you to screen them out or filter out their responses.
-
Add an optional single-choice question (checkbox) somewhere in your survey. The question and location is not relevant as it will be hidden from humans. For example, “Are you human?”
[ ] Yes. -
Add the following JavaScript to that question, by replacing the existing
Qualtrics.SurveyEngine.addOnloadfunction:Qualtrics.SurveyEngine.addOnload(function() { jQuery("#"+this.questionId).hide(); }); -
Preview the survey to check that the question is hidden when the page loads.
-
- Add a required choice question that checks respondent’s attention and logic. For example, directly state which answer they should choose or ask which year it is.
- Add illogical options to multiple-choice questions. For example, in the question “Which of these tools do you use for code review?” add an illogical option like
[ ] Tanuki Code. - Ask the same required question at two separate points of the survey. Try to use a simple multiple-choice question that people can easily answer. For example, their job title or their team size.
- For all three question types above, if you want to screen out respondents based on their answers, see the Branching Respondents Out of the Survey section under the Screening Out Respondents in the Survey Flow section. After adding the survey flow logic described in that section, you can then decide to just flag those responses for later analysis or immediately discard them.
In addition, if your survey is shared on multiple social media channels, you can track from what source a participant is accessing the survey by passing information through query strings. This can help filter out responses if one source seems to have more spam than others.
Filter out spam responses after closing the survey
After closing your survey, its now time to see how much the prevention measures have mitigated spam responses and which responses we still need to filter out. The Response Quality feature automatically flags responses for you based on a number of criteria.
- View the Response Quality report and filter out responses.
- Check for illogical responses to open-ended questions, if applicable.
- Check for respondents who complete your survey too quickly. The Response Quality feature attempts to flag “speeder” responses but it only works for surveys with at least 100 responses.
- Check for duplicate email addresses, if applicable. Also pay attention to
@aol.com,@yahoo.com, and@hotmail.comemail addresses that are frequently used to spam surveys.
Embedded data
Note: These instructions are only applicable to UX Researchers and Research Coordinators.
When users sign-up to GitLab First Look, we automatically collect the following embedded data:
GitLab user- Whether or not the person is a GitLab user.Yes- the person is a GitLab user.No- the person is not a GitLab user.
Job title- What the person’s job title is.Back-end Engineer/DeveloperDesignerDevOps EngineerExecutive (VP of Engineering, CTO, CEO, etc)Front-end Engineer/DeveloperFull-stack Engineer/DeveloperInfrastructure EngineerOperations EngineerPenetration TesterProduct ManagerProject ManagerQuality Assurance EngineerResearcherSecurity AnalystSecurity ProfessionalScientistSite Reliability EngineerSoftware Engineer/DeveloperStudentSystems Administrator/EngineerUnemployedOther
Organisation size- How many people work within the user’s organisation? (Added August 2019)0-10 people11-100 people101-500 people501-1000 people1001-10,000 people10,000+ people
Team size- How many people work within the user’s team (Added August 2019)0 - it's just me!1-5 people6-10 people11-20 people21-30 people30+ people
SaaS (GitLab.com) packageFreeBronzePremium (Previously Silver)Ultimate (Previously Gold)I don't know
Self managed packageCoreStarterPremiumUltimateI don't know
- Something missing from this list? Let Caitlin know and she will get it added!
- When using an
Embedded Data ValueQualtrics doesn’t automatically auto-complete the value as you begin typing it. The search functionality can also be haphazard. Therefore, ensure you type out the value in full, as it is displayed above. - Embedded data fields used to be case-sensitive. For the vast majority of Qualtrics’ users, embedded data is no longer case-sensitive, meaning “test” and “Test” would be treated as the same field. However, Qualtrics still advise matching cases as a best practice, as there are a small portion of accounts where this change has not been made.
- Not all Embedded Data Values were created at the point of GitLab’s First Look creation. Therefore, we don’t necessarily have completed values for every user. It’s also worth noting that some values for users may change over time. For example, someone may change jobs which may impact their job title, organisation and team size. Therefore, there may be some discrepancies in the information we hold about users. We plan to reduce this risk by periodically asking members of GitLab First Look to check and, where necessary, update the information we have on file for them.
What to do if your sample size is lower than expected
Note: These instructions are only applicable to UX Researchers and Research Coordinators.
There could be a couple of reasons why your sample number is lower than expected:
- The contact frequency for GitLab First Look has been exhausted. By default, no member of GitLab First Look receives an email more than once a week or four times a month. If this is the case, you will need to either delay sending your survey (you may only need to delay sending your survey by a day - reach out to the UX Research Coordinator for confirmation) or source users outside of the GitLab First Look panel.
- There aren’t enough GitLab First Look members that match your sampling criteria.
- There’s an error in your sampling criteria.
- For options 2 and 3, navigate to your sample and click
List options, selectEdit sampleto change your sampling criteria.
Distributing your survey to GitLab.com users
Note: These instructions are only applicable to UX Researchers and Research Coordinators.
There will be studies where you wish to target specific populations of users based on some criteria (for instance, users that have authored at least 5 merge requests in the last 30 days). If it’s possible to generate a list of user IDs for a given criteria (typically from the data warehouse), you can use that list to push those users contact info into Qualtrics and distribute a survey. Note that this is limited to users of GitLab.com and does not include Self-Managed users.
- Generate your list of GitLab.com user IDs and put them into the first column of a Google Sheet. The first entry in the first column (A1) should be
id, as this confirms that this is a list of ids that you want to use. Note: The GitLab.com user ID you specified in your Google Sheet will be included in the Qualtrics mailing list as embedded data. You can use this to associate any responses you get with your original user list. - The name of the specific sheet (or tab) should be what you want to name the Qualtrics mailing list, for example,
05/20 - CI Pipeline Prototype Testing. This name cannot contain the following characters:. < >. Doing so will case an error in the transfer to Qualtrics. - The filename of the entire spreadsheet should be
qualtrics_mailing_list.followed by the name of the worksheet/mailing list that you used in the step above. So keeping with our previous example,qualtrics_mailing_list.05/20 - CI Pipeline Prototype Testing - Once everything is ready, move the file into the
QualtricsRequestGoogle Drive folder. - If everything was done correctly, within about 15 minutes, the
identry in A1 should turn intoprocessing. That means the data pipeline is working on your request. - A1 will show
processed. Your mailing list should now be in Qualtrics at this point. - Add
processed_to the filename in order to make it clear which files have been completed, as well as to keep the process executing as quickly as possible in the future. - The list will show up as a shared list for the UX Research & Product directory. You can access the list itself from the Contacts section of Qualtrics, or you can select the list as part of the process of sending an email distribution.
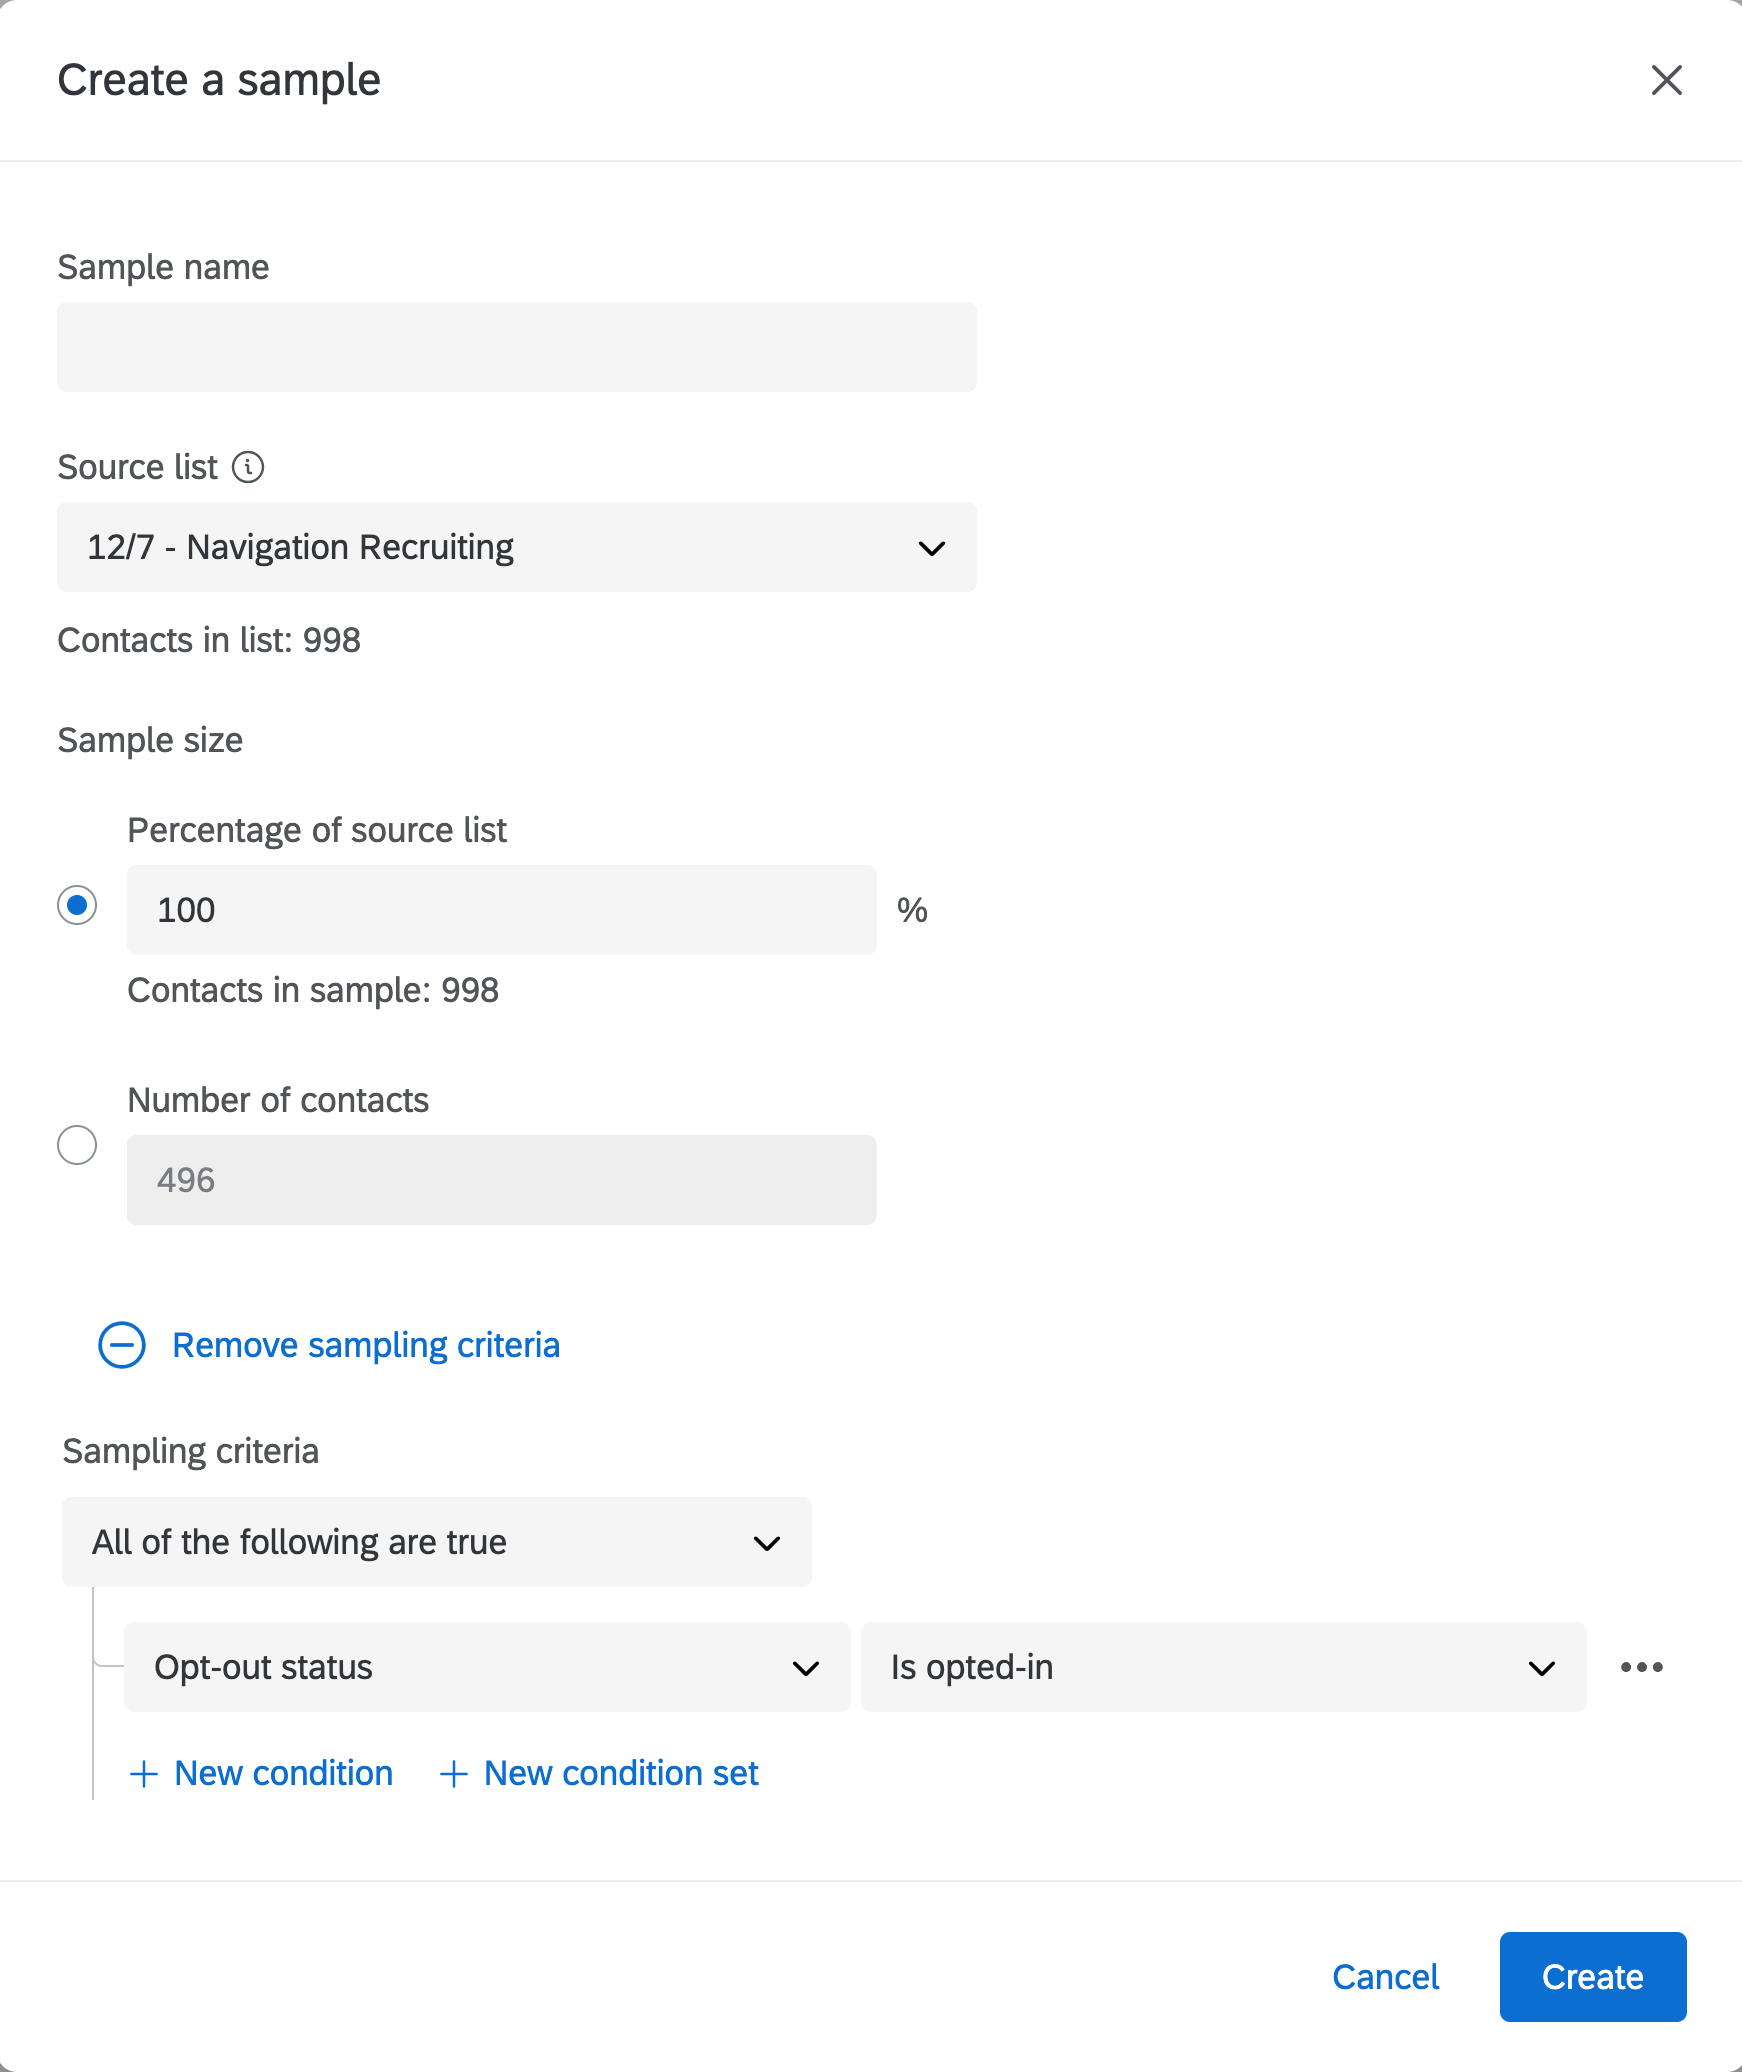
- IMPORTANT: Create a sample of the list you just created to filter out users who have opted-out. To do this, navigate to the new list in Qualtrics, click the
List Optionsdropdown in the top right hand corner, selectCreate sample from list, name the sample, clickAdd sampling criteria, chooseOpt-out statusfrom the dropdown, and make sureIs opted-inis selected. This will ensure that no users who have opted-out of email communication will be contacted. From there, selectCreateand Qualtrics will make the sample of users who have opted into emails from GitLab. The sample created will be the one used to distribute emails.
If you have followed all of the above steps correctly and your spreadsheet does not process within 20 minutes of adding it to the Qualtrics Request drive, the Qualtrics Data Pipeline might be broken. To fix it, open up an issue using the DE Triage template in the GitLab Data Team project. Here’s an example of a previous issue opened by the team.
Tips for increasing survey response rate
- Keep the number of survey questions to a minimum (Hubspot recommends 10 questions or fewer) and keep question types basic (avoid multiple open ended questions or matrix style questions).
- Tell respondents in the email about the goal of the survey and how long it will take to complete.
- Use inviting subject lines in your email to get potential respondents to open them (
We would love to hear from you,How did we do?,Take a quick 5 minute survey). - Avoid including certain formatting (all caps), characters (exclamation marks), or words in the email (last chance) subject line to keep the email from going into spam folders.
- Use real names whenever possible to personalize who the survey is getting sent to and who is conducting the research.
- Pilot test surveys in advance to find points where respondents get confused or might want to stop filling it out.
- Remove any company specific jargon that might not be understood by respondents.
- Brand the email and/or survey with a company logo to indicate that it is legitimate.
- Allow respondents to fill out the survey anonomously and communicate that their survey responses will be anonymous.
- Provide some form of incentive (for example: gift card or company swag item) whenever possible.
- Embed the first question of the survey in the body of the email or include a
Start Surveybutton to make it clear how to participate. - Use multiple distribution methods to send out your survey (for example: email, social media, company website, blog). Whenever possible, track the completion rates associated with each method of distribution, so you can understand which method(s) were successful or unsucessful.
- Optimize your email for mobile devices whenever possible.
- Assure respondents as early as possible how their data will be kept secure (for example: data will be used internally at GitLab and research reports will not include customer names and/or contact information).
- For surveys sent to customers at small to medium businesses or enterprises, try to distribute the survey during early morning (10am-12pm) or late afternoon (3pm-6pm) work hours to increase response rates.
- Surveys should be sent out only on weekdays (Mondays-Fridays). Surveys usually have the best response rates on Mondays.
How to create a tracked link
You may want to promote a survey using several methods, and keep track of which one performs the best (for example: GitLab social, ux team social, in a blog post, or in a banner within gitlab.com). You can do this by using query strings.
How to delete a contact from our directory
UX Research Coordinators occasionally receive requests to remove a contact from all lists. It’s important to note that each list is independent, so removing a contact from one list does not automatically remove them from others they may have subscribed to.
UX Research Coordinators, or other team members with Qualtrics Brand Administrator access, must remove contacts on a global level to prevent them from receiving future emails.
To remove a contact from your directory:
- Log into your Qualtrics account
- Click on the Contacts tab on the top right
- Click on Directory Contacts
- Search for the contact you want to delete
- Select the contact
- Options should display on the right side of the page after selecting a contact
- Click on the wrench icon
- Select Delete Contact
9b1952da)
