Using Kibana
Overview
This document provides information on what Kibana is, how to search it, interpret its results, and contains tips and tricks on getting specific information from it.
Using Kibana
Kibana is an open source data visualization plugin for Elasticsearch. It provides visualization capabilities on top of the content indexed on an Elasticsearch cluster. Support Engineering uses Kibana to both search for error events on GitLab.com and to detect when specific changes were made to various aspects of it by a user.
For non-production environments such as staging (gstg), use https://nonprod-log.gitlab.net/
Note: Kibana defaults to the UTC time zone. It does not retain logs older than 30 days. If you’re working on a ticket where access to older logs would have been helpful, please flag it via the
Support::SaaS::Log retention period reachedmacro (This is an internal macro for tracking purposes only).
Parameters
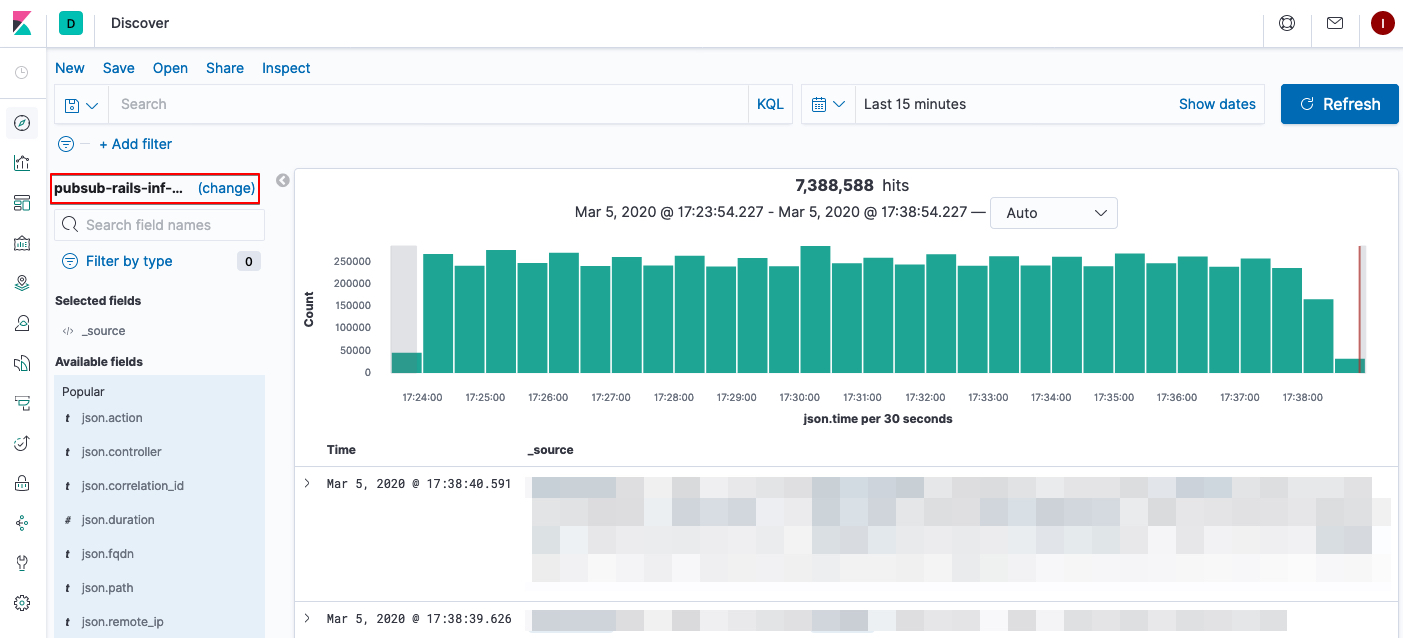
Knowing where to search in Kibana is paramount to getting the proper results. The area of the application (GitLab.com) that you’re searching is known as the Index in Kibana. The default index used for searching is pubsub-rails-inf-gprd-* but you can change this by clicking the (change) button:
Indexes closely correlate for the most part with our log structure in general. Some other frequently used indexes are:
pubsub-gitaly-inf-gprd-*pubsub-pages-inf-gprd-*pubsub-runner-inf-gprd-*
For example, if you’re trying to track down failed logins you would search the index pubsub-rails-inf-gprd-*. To search for 500 errors involving a controller you’d search in pubsub-rails-inf-gprd-*, the default index.
Along with the index, knowing when a specific error or event ocurred that you’re trying to track down is important and it’s important to keep in mind that Kibana logs on GitLab.com persist for thirty days. Kibana allows you to choose relative and absolute time ranges for search results and this can be changed by manipulating the date range:

Fields and Filters
Note: As of March 2022, using Filters is the recommended way for searching Kibana. Using the general search box is discouraged as it may generate several errors in the form of X of Y Shards Failed. See Infra Issue.
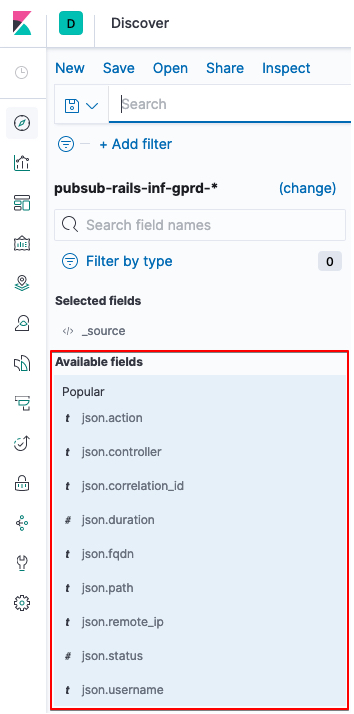
Each log entry is comprised of a number of Fields in which the specific information about the entry is displayed. Knowing which fields to apply to your search results and how to filter for them is just as important as knowing where and when to search. The most important fields are:
json.methodjson.actionjson.controller- for more on this see the controller definitions in the GitLab sourcecodejson.statusjson.path
All available fields are displayed along the left-hand side menu and you can add them to your search results by hovering over each and clicking the add button.
If you don’t filter for specific fields it can be difficult to find specific log entries if a large number of them are returned on your search query.
For example, we’re trying to locate any log events generated by the GitLab.com user tristan that returned a 404 status code within the last 15 minutes. We can start by searching the pubsub-rails-inf-gprd-* index for json.username : tristan within that time range and we’d get results similar to the following once we click add next to the json.status field along the left-hand side bar:
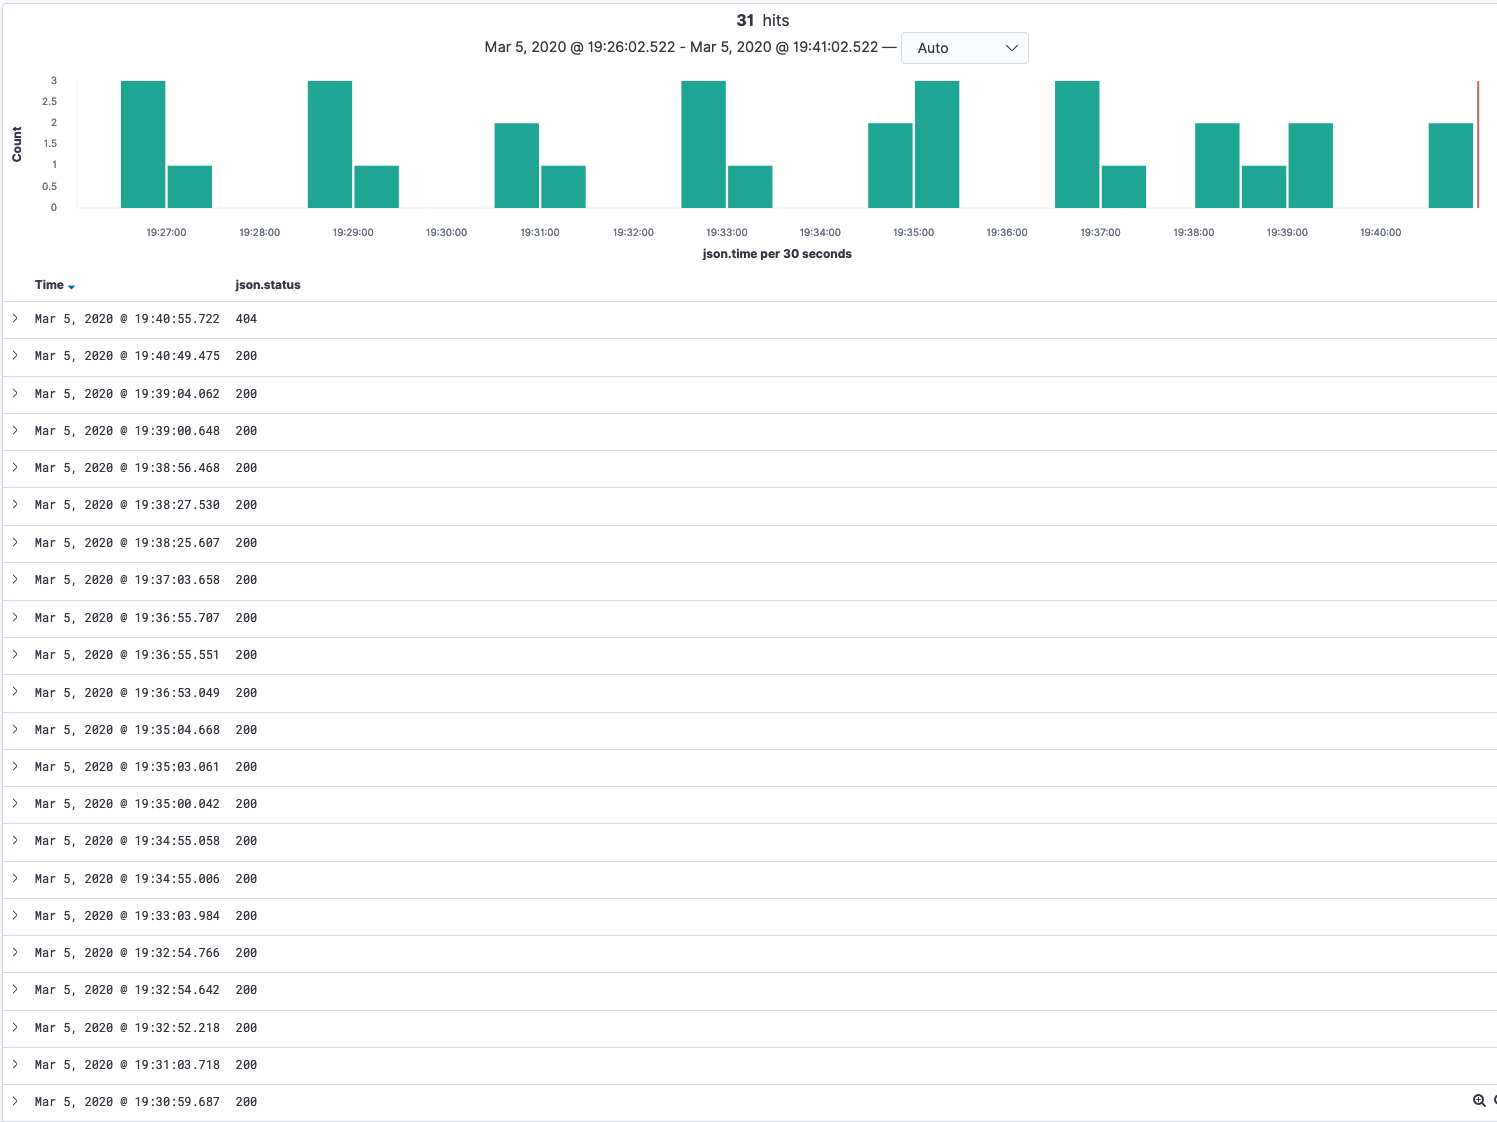
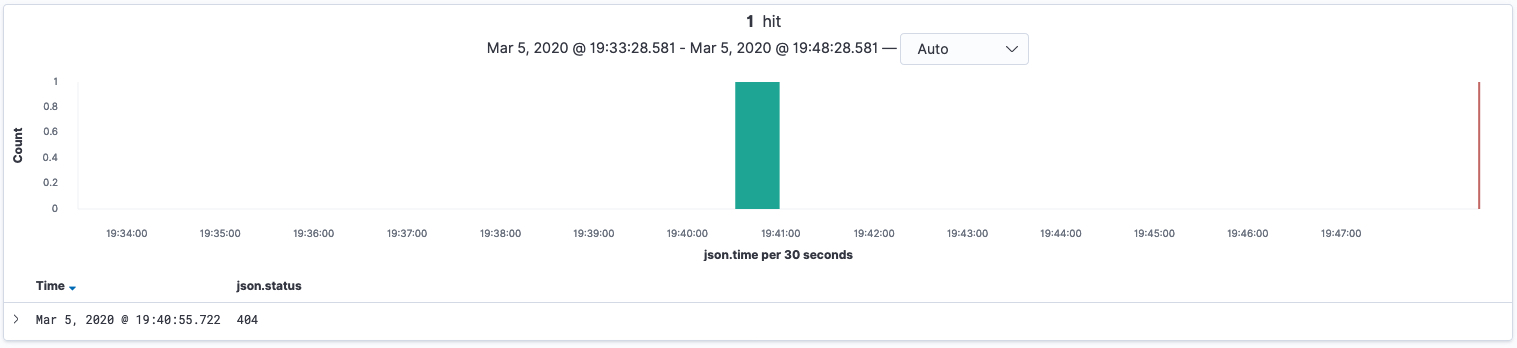
The majority of results as entries that returned 200, which aren’t in the scope of what we’re looking for. To search for results where 404 was returned we can click + Add Filter underneath the search bar and place a positive filter on json.status is 404, which will give us these results, exactly what we’re looking for.
Identify cause of IP Blocks
There are some useful tips here about searching kibana for errors related to IP blocks.
Log Identification
Not sure what to look for? Consider using a Self-Managed instance to replicate the bug/action you’re investigating. This will allow you to confirm whether or not an issue is specific to GitLab.com, while also providing easily accessible logs to reference while searching through Kibana.
Support Engineers looking to configure a Self-Managed instance should review our Sandbox Cloud page for a list of available (company provided) hosting options.
Sharing logs
To share the current state of your log search, follow Elastic’s log sharing documentation. Copying the URL directly will fail to load your search when other users attempt to use it. Since it is encoded, your search parameters will not be included in the URL.
Dashboards
There are a number of available dashboards that are designed to create visualizations that can help in identifying patterns. It can also be useful for narrowing in on specific areas of the product or a identifying a specific issue or bug. While any GitLab team member can create a dashboard that can be used by anyone, there are a few support specific dashboards:
- Correlation Dashboard
- Rate Limit & Requests Dashboard
- Integrations Dashboard
- Errors & Exceptions Dashboard
You can access dashboards in Kibana under Analytics > Dashboard and filtering by the Support tag or by searching for the name of the dashboard.
If you are interested in creating your own dashboard, you might want to consider reading Elastic’s guide on creating dashboards. If you’ve created something that might have a wider use, consider adding the Support tag to your dashboard so it is easily found by other support team members.
To use dashboards, be sure you are in View mode. In view mode, you can input values and it will update the visuals accordingly but not save it to the dashboard. Use Share > Get Links if you need to share the snapshot of what you captured.
Before editing an existing dashboard, consider cloning it to make your own copy and label it accordingly.
Correlation Dashboard
If you found a Correlation ID that is relevant for your troubleshooting, you can utilize the correlation dashboard to quickly view all related components across indices without having to search each individual index. Once you view the dashboard, simply click on the json.correlation_id filter and enter in your found correlation ID. It will then search across web, workhorse, sidekiq, and gitaly indices.
Rate Limit & Requests Dashboard
Use this dashboard to quicky filter records by username, IP, path, or namespace. This is useful when you are trying to determine if a User or IP is being subject to rate limiting and you need to discover and visualize usage patterns.
Integrations Dashboard
This can be useful to track down errors related to specific integrations across an entire namespace.
Errors & Exceptions Dashboard
This dashboard can be used to get specific http statuses across a namespace or path/project and narrow down by class. This can be useful for understanding error patterns across a namespace or even across the entirety of GitLab.com.
Tips and Tricks
This section details how you can find very specific pieces of information in Kibana by searching for and filtering out specific fields. Each tip includes a link to the group, subgroup, or project that was used in the example for reference.
Runner Registration Token Reset
Example group: gitlab-bronze
We can determine if the GitLab Runner registration token was reset for a group or project and see which user reset it and when. For this example the Runner registration token was reset at the group-level in gitlab-bronze. To find the log entry:
- Set the date range to a value that you believe will contain the result. Set it to
Last 7 daysif you’re unsure. - Add a positive filter on
json.pathfor the path of the group, which is justgitlab-bronzein this example. - Add a positive filter on
json.actionforreset_registration_token. - Observe the results. If there were any they will contain the username of the user that triggered the reset in the
json.usernamefield of the result.
Access Token activity
We can determine the kind of activities an Access Token (Group, Project, Personal) is performing. To find the log entry:
- Find the
idof the Access Token you are interested in using the API or UI. - In
pubsub-rails-inf-gprd-*, set the date range to a value that you believe will contain the result. Set it toLast 7 daysif you’re unsure. - Add a positive filter on
json.token_idfor theidin step 1. - Add other filters that you might be interested in:
json.usernamejson.pathjson.methodjson.token_type
Deleted Group/Subgroup/Project
- Example group: gitlab-silver
- Example project: gitlab-silver/test-project-to-delete
Kibana can be used to determine who triggered the deletion of a group, subgroup, or project on GitLab.com. To find the log entry:
- In
pubsub-rails-inf-gprd-*, set the date range to a value that you believe will contain the result. Set it toLast 7 daysif you’re unsure. - Add a positive filter on
json.pathfor the path of the project, including the group and subgroup, if applicable. This isgitlab-silver/test-project-to-deletein this example. - Add a positive filter on
json.methodforDELETE. - Observe the results. If there were any they will contain the username of the user that triggered the deletion in the
json.usernamefield of the result. When a project or a group is first going to pending deletion the log entry will havejson.params.key: [_method, authenticity_token, namespace_id, id], compare to when a user is forcing the deletion then the log entry looks likejson.params.key: [_method, authenticity_token, permanently_delete, namespace_id, id]for project or looks likejson.params.key: [_method, authenticity_token, permanently_remove, id]for group.
To see a list of projects deleted as part of a (sub)group deletion, in sidekiq:
- Filter
json.messageto “was deleted”. - Set a second filter
json.messagetopath/group.
Viewed CI/CD Variables
While we do not specifically log changes made to CI/CD variables in our audit logs for group events, there is a way to use Kibana to see who may have viewed the variables page. Viewing the variables page is required to change the variables in question. While this does not necessarily indicate someone who has viewed the page in question has made changes to the variables, it should help to narrow down the list of potential users who could have done so. (If you’d like us to log these changes, we have an issue open here to collect your comments.)
- Set a filter for
json.pathisand then enter the full path of the associated project in question, followed by/-/variables. For example, if I had a project namedtanuki-rules, I would entertanuki-rules/-/variables. - Set the date in Kibana to the range in which you believe a change was made.
- You should be able to then view anyone accessing that page within that time frame. The
json.meta.usershould show the user’s username and thejson.timeshould show the timestamp during which the page was accessed. - You may also be able to search by
json.graphql.operation_nameisgetProjectVariables. - In general, a result in the
json.actionfield that returnsupdateandjson.controllerreturningProjects::VariablesControlleris likely to mean that an update was done to the variables.
Find Problems with Let’s Encrypt Certificates
In some cases a Let’s Encrypt Certificate will fail to be issued for one or more reasons. To determine the exact reason, we can look this up in Kibana.
- Set a positive filter for
json.messageto “Failed to obtain Let’s Encrypt certificate”. - In the search bar, enter in the GitLab Pages domain name. For example
json.pages_domain: "sll-error.shushlin.dev" - Filter by or find
json.acme_error.detailThis should display the relevant error message. In this case, we can see the error “No valid IP addresses found for sll-error.shushlin.dev”
Deleted User
Kibana can be used to find out if and when an account on GitLab.com was deleted if it occurred within the last thirty days at the time of searching.
- Set the date range to a value that you believe will contain the result. Set it to
Last 7 daysif you’re unsure.
If an account was self-deleted, try searching with these filters:
- Add a positive filter on
json.usernamefor the username of the user, if you have it. - Add a positive filter on
json.controllerforRegistrationsController.
If an account was deleted by an admin, try searching with these filters:
- Add a positive filter on
json.params.valuefor the username of the user. - Add a positive filter on
json.methodforDELETE.
Observe the results. There should be only one result if the account that was filtered for was deleted within the specified timeframe.
If you suspect an account was deleted by the cron job that deletes unconfirmed accounts, try searching with these filters:
- Change to the
pubsub-sidekiq-inf-gprd*index. - Add a positive filter on
json.meta.userfor the username of the user. (Alternatively, you can usejson.args.keywordand use the User ID of the user if you have that). - Add a positive filter on
json.classforDeleteUserWorker.
Disable Two Factor Authentication
Kibana can be used to find out which admin disabled 2FA on a GitLab.com account. To see the log entries:
- Set the date range to a value that you believe will contain the result. Set it to
Last 7 daysif you’re unsure. - Add a positive filter on
json.locationfor theusername2FA was disabled for. - Add a positive filter on
json.actionfordisable_two_factor. - To make things easier to read, only display the
json.locationandjson.usernamefields. - Observe the results.
Enable/Disable SSO Enforcement
Kibana can be used to find out if and when SSO Enforcement was enabled or disabled on a group on GitLab.com, and which user did so.
- Example group: gitlab-silver
Enable SSO Enforcement
- Set the date range to a value that you believe will contain the result. Set it to
Last 7 daysif you’re unsure. - Add a positive filter on
json.controllerforGroups::SamlProvidersController. - Add a positive filter on
json.actionforupdate. - Add a positive filter on
json.methodforPATCH. - Add a positive filter on
json.pathfor the path of the group,gitlab-silverin this example case. - If there are any results, observe the
json.paramsfield. If\"enforced_sso\"=>\"1\"is present, that entry was logged when SSO Enforcement was enabled by the user in thejson.usernamefield.
Disable SSO Enforcement
- Set the date range to a value that you believe will contain the result. Set it to
Last 7 daysif you’re unsure. - Add a positive filter on
json.controllerforGroups::SamlProvidersController. - Add a positive filter on
json.actionforupdate. - Add a positive filter on
json.methodforPATCH. - Add a positive filter on
json.pathfor the path of the group,gitlab-silverin this example case. - If there are any results, observe the
json.paramsfield. If\"enforced_sso\"=>\"0\"is present, that entry was logged when SSO Enforcement was disabled by the user in thejson.usernamefield.
SAML log in
To investigate SAML login problems:
In the pubsub-rails-inf-gprd-* log:
- Set the date range to a value that you believe will contain the result. Set it to
Last 7 daysif you’re unsure. - Add a positive filter as advised in our SAML groups docs.
After decoding the SAML response, and observing the results corresponding to your chosen filters, you can see if there are any missing or misconfigured attributes.
SCIM provisioning and de-provisioning
To investigate SCIM problems:
In the pubsub-rails-inf-gprd-* log:
- Set the date range to a value that you believe will contain the result. Set it to
Last 7 daysif you’re unsure. - Add a positive filter on
json.pathfor:/api/scim/v2/groups/<group name>when looking at the SCIM requests for a whole group. This path can also be found in the group’s SAML settings./api/scim/v2/groups/<group name>/Users/<user's SCIM identifier>when looking at the SCIM requests for a particular user.
- Add a positive filter on
json.methhodforPOSTorPATCH(first time provisioning or update/de-provisioning respectivley). - Add a filter on
json.params.valueto further identify specific actions:json.params.value=Addreveals first time provisioning, or account detail changesjson.params.value=Replacereveals SCIM deprovisioning, happens when a user has been removed from the IdP App/groupjson.params.value=<External ID>reveals any SCIM activity related to the identified External ID.
In cases where the SCIM provisioned account is deleted:
- Follow the above steps and get the
correlation_idfrom the provisioning record withPOSTasjson.method. - Go to the Correlation Dashboard and search for the relevant
correlation_id. - In the results, look for records in the
Correlation Dashboard - Websection, and an entry withelasticsearchasjson.subcomponent. In that entry, find theuser_idinjson.tracked_items_encodedin the format of[[numbers,"User <user_id> user_<user_id>"]].
To investigate if the user was deleted due to an unconfirmed email, follow the Deleted User procedure.
Searching for Remove User from group or subgroup
If it happened within the retention period (30 days), Kibana can be used to determine if, when and by whom a user was removed from a group or subgroup
To find the log entry in pubsub-rails-inf-gprd-* with the following data points:
Confirm the Remove User (DELETE)
- Add a positive filter on
json.meta.caller_idforGroups::GroupMembersController#destroy - Add a positive filter on
json.meta.user_idfor user id of person that performed the remove user action in the UI - Add a positive filter on
json.methodforDELETE
Retrieve further details about the Remove User request
The following filters can help identify users that were removed and what group or subgroups they have been removed from
- Add a positive filter on
json.custom_messageforMembership destroyed - Add a positive filter on
json.meta.caller_idforGroups::GroupMembersController#destroy - Add a filter for user id
json.meta.user_idor usernamejson.meta.userof the user that performed the Remove User action - Add a filter for target user id
json.details.target_id
Searching for Deleted Container Registry tags
Kibana can be used to determine whether a container registry tag was deleted, when, and who triggered it, if the deletion happened in the last 30 days.
To find the log entry in pubsub-rails-inf-gprd-*:
- Get the link for the container registry in question. (For exmaple: https://gitlab.example.com/group/project/container_registry/
) - Set the date range to a value that you believe will contain the result. Set it to
Last 7 daysif you’re unsure. - Add a positive filter on
json.graphql.variablesfor*ContainerRepository/<regitsry id>.*. - Add a positive filter on
json.graphql.operation_namefordestroyContainerRepositoryTags.
Searching Kibana for 500 level errors
As of 14.7, a Correlation ID is provided on the 500 error page when using the interface. You can ask the customer to supply this and use Kibana to filter by json.correlation_id.
Kibana is not typically used to locate 5XX errors, but there are times where they can’t be easily found in Sentry and searching Kibana first is beneficial. To perform a general search in Kibana:
- Obtain the full URL the user was visiting when the error occurred.
- Log in to Kibana.
- Select the correct time filter (top right) - e.g last 30 minutes, 24 hours, or 7 days.
- In the search field, type
json.path : "the_path_after_gitlab.com_from_the_URL" - Choose relevant fields from the sidebar. For a
500error, you want to filter forjson.statusand chooseis, then enter500. - Continue to use relevant fields from the list on the sidebar to narrow down the search.
See the 500 errors workflow for more information on searching and finding errors on GitLab.com
Filter by IP Range
Customers will sometimes give us an IP Range of their resources such as their Kubernetes cluster or other external servers that may need to access GitLab. You can search a range by using Elasticsearch Query DSL.
- Click
+ Add Filter>Edit as Query DSL - Use the following format to create your query:
{
  "query": {
    "term": {
      "json.remote_ip": {
        "value": "192.168.0.1/20"
      }
    }
  }
}
- Click Save to perform your query.
Note that depending on the range, this operation may be expensive so it is best to first narrow down your date range first.
Import Errors
Most timeout related imports end up with a partial import with very few or zero issues or merge requests. Where there is a relatively smaller difference (10% or less), then there are most likely errors with those specific issues or merge requests.
Anytime there is an error, ensure that the export originated from a compatible version of GitLab.
Here are some tips for searching for import errors in Kibana:
- Use the pubsub-sidekiq-inf-gprd index pattern (Sidekiq logs) and try to narrow it down by adding filters
- json.meta.project:
path/to/project - json.severity: (not
INFO) - json.job_status: (not
done) - json.class is
RepositoryImportWorker
- json.meta.project:
- Use the pubsub-rails-inf-gprd index pattern (Rails logs) and try to narrow it down by adding filters
- json.controller:
Projects::ImportsControllerwith error status - json.path:
path/to/project
- json.controller:
- In Sentry, search/look for:
Projects::ImportService::Error; make sure to remove theis:unresolvedfilter.
If there is an error, search for an existing issue. Errors where the metadata is throwing an error and no issue exists, consider creating one from Sentry.
If no error is found and the import is partial, most likely it is a timeout issue.
Export Errors
Export errors can occur when a user attempts to export via the UI or this API endpoint. A parameter in the API allows for exporting to an external URL such as a pre-signed AWS S3 URL. Typically, the export process consists of:
- Returning an initial
202response to the client confirming the export has started - Taking from a few seconds to a few minutes to process the export, depending on the project size
- Starting the upload to the specified upload URL
Here are some suggestions for searching export logs in Kibana:
- In
pubsub-sidekiq-inf-gprd(Sidekiq), narrow the search by adding filters:- json.class:
Projects::ImportExport - json.meta.project
path/to/project
- json.class:
The Projects::ImportExport class will include the following subcomponents:
Projects::ImportExport::RelationExportWorkerProjects::ImportExport::CreateRelationExportsWorkerProjects::ImportExport::ParallelProjectExportWorkerProjects::ImportExport::WaitRelationExportsWorkerProjects::ImportExport::AfterImportMergeRequestsWorker
If using the Correlation Dashboard, you should be able to follow Sidekiq events throughout the export process, and locate errors by filtering json.severity: ERROR. Provided below is an example of an upload failing to AWS S3:
"severity": "ERROR",
      "meta.caller_id": "ProjectExportWorker",
      "subcomponent": "exporter",
      ...
      "message": "Invalid response code while uploading file. Code: 400",
      "response_body": "<?xml version=\"1.0\" encoding=\"UTF-8\"?>\n<Error><Code>EntityTooLarge</Code><Message>Your proposed upload exceeds the maximum allowed size</Message><ProposedSize>6353524398</ProposedSize><MaxSizeAllowed>5368709120</MaxSizeAllowed><RequestId><omitted></RequestId><HostId><omitted></HostId></Error>",
The XML response can provide an indication of the failure reason, such as the project exceeding the maximum allowed size:
<?xml version="1.0" encoding="UTF-8"?>
<Error>
    <Code>EntityTooLarge</Code>
    <Message>Your proposed upload exceeds the maximum allowed size</Message>
    <ProposedSize>6353524398</ProposedSize>
    <MaxSizeAllowed>5368709120</MaxSizeAllowed>
    <RequestId>
        <omitted>
    </RequestId>
    <HostId>
        <omitted>
    </HostId>
</Error>
Known Import Issues
- Imported project’s size differs from where it originated
- See this comment for an explanation as to why. As artifacts are part of repository size, whether they are present can make a big difference.
- Repository shows 0 commits.
- See 15348.
Purchase Errors
Kibana can be used to search for specific errors related to a purchase attempt. Since purchases can be made either in GitLab.com or CustomersDot, it is important to determine which system a customer was using to make the purchase; then use the tips specific to the system below. Note: the ticket submitter might not be the customer making the purchase.
GitLab.com purchase errors
Note: You need to have the GitLab username of the account used to make the purchase. Sometimes the user fills the GitLab username value of the ticket fields, or you can check the ticket requester’s GitLab username in the User Lookup in the GitLab Super App.
- Navigate to Kibana
- Ensure the
pubsub-rails-inf-gprd-*index pattern (GitLab.com logs) is selected. - Set the date range to a value that you believe will contain the result. Set it to
Last 7 daysif you’re unsure. - Add a positive filter on
json.user.usernamefor the username of the account used to make the purchase. - Add a positive filter on
json.tags.feature_categoryforpurchase.
Feeling Lazy? Go to https://log.gprd.gitlab.net/goto/6aac4580-9d9b-11ed-85ed-e7557b0a598c and update the value of json.user.username.
If you encounter a generic error message try checking CustomersDot purchase error logs in Kibana or GCP for a more specific error.
Tip: To see the details of a user’s purchase attempt, go to https://log.gprd.gitlab.net/goto/45bb89c0-6ccc-11ed-9f43-e3784d7fe3ca and update the value of json.username.
CustomersDot purchase errors
Note: You need to have the CustomersDot customer ID of the account used to make the purchase. Refer to Step 1 under this section on how to get the customer ID.
- Navigate to Kibana
- Ensure the
pubsub-rails-inf-prdsub-*index pattern (CustomersDot logs) is selected. - Set the date range to a value that you believe will contain the result. Set it to
Last 7 daysif you’re unsure. - Add a positive filter on
json.customer_idfor the username of the account used to make the purchase. - Add a positive filter on
json.severityforERROR.
Feeling Lazy? Go to https://log.gprd.gitlab.net/goto/9c28ba80-9d9b-11ed-9f43-e3784d7fe3ca and update the value of json.customer_id.
In case you have the namespace details, get the Namespace ID then go to https://log.gprd.gitlab.net/goto/b598dfe0-9d9b-11ed-9f43-e3784d7fe3ca and update the value of json.params.gl_namespace_id
Check user actions on a repository
When looking at the pubsub-rails-inf-gprd-* index, you can determine if a user has recently cloned/pushed (with HTTPS), or downloaded a repository. You can filter by json.username, json.path (the repository), and json.action to find specific events:
action: git_upload_packis when someone performs a clone of a repository.action: git_receive_packis when someone push’s a repository.action: archiveis when someone downloads a repository via theDownload source codebutton in the UI.
To search for git activity over SSH, you can instead look in the pubsub-shell-inf-gprd-* index for specific events (note the minus signs instead of underscores):
command: git-upload-packis when someone performs a clone over SSH.command: git-receive-packis when someone performs a push over SSH.
You can use the links in the lists above and fill in the json.path or json.gl_project_path for the project of interest.
Webhook related events
Webhook events for GitLab.com can be located in Kibana, including identifying when a group or project has gone over enforced rate limits. Rate limiting varies depending on the subscription plan and number of seats in the subscription.
Here are some suggestions:
- Use
pubsub-sidekiq-inf-gprd(Sidekiq) with the filtersjson.class: "WebHookWorker"andjson.meta.project : "path/to/project"to identify webhook events. - Use
pubsub-rails-inf-gprd-*(Rails) with the filtersjson.message : "Webhook rate limit exceeded"andjson.meta.project : "path/to/project"to identify webhooks that failed to send due to rate limiting.- You can filter between Group and Project hooks by using
json.meta.related_class : "GroupHook"orjson.meta.related_class : "ProjectHook".
- You can filter between Group and Project hooks by using
Searching for Service Desk emails
When searching through Kibana for the json.to_address, make sure this is the address that appears on the to: line in the email, even if this is aliased to the GitLab project email address. If you search for the project email address and the Service Desk mail was sent to an alias of that (support@domain.ext for example), it won’t show up in the searches.
Searching for identity verification SMS logs
When searching for identity verification SMS logs, use the pubsub-rails-inf-gprd-* index and apply the below filters:
json.message: "IdentityVerification::Phone"json.username: <username>- When checking logs for a specific user/customer
You can also use this saved search link with some useful fields pre-selected and the above filters applied.
The key JSON fields to look out for are:
json.telesign_responsejson.telesign_status_codejson.telesign_reference_idin cases where we need to check further in Telesign
We expect to see telesign_response like Delivered to handset with a status code of 200 in a good case where the message was delivered by GitLab. If you can see Delivered to handset and the user/customer still has not received the code, it is possible that their device/carrier/messaging app is causing problems.
2ea03576)
