Evaluation Methods
⚠️ This framework is undergoing evaluation in a pilot program ⚠️
If Jobs-to-be-Done is the theory, then Outcome-Driven Innovation is the practice.
Continuous Evaluation
Continuous evaluation involves establishing predictable, repeatable, low-effort, and high-efficacy methods complemented by consistent feedback loops. This process includes generating regular benchmark scores and assessing solutions against these benchmarks. Implementing continuous evaluation ensures ongoing improvement and alignment with user needs, leading to higher user satisfaction and better product performance.
Evaluation Methods
Benchmarking the Domain With The Outcome Survey
Benchmarking helps identify improvement areas, evaluate whether we’re innovating effectively, meeting user expectations, measuring progress, setting performance standards, and understanding the competitive landscape. This is all achieved through an Outcome Survey.
An Outcome Survey identifies and prioritizes the specific Outcomes that users seek when using a product or service. Unlike traditional surveys that focus on user satisfaction or feature preferences, an Outcome Survey delves into the fundamental Job that users are trying to accomplish and the specific desired Outcomes related to that Job. This structured approach enables product teams to pinpoint and prioritize the Outcomes that drive user behavior and satisfaction, guiding product development efforts toward delivering solutions that effectively address these critical user needs.
Process & Survey Design
You will find everything you need to get started in the Qualtrics template. (Library/UX Research & Product/Templates/Opportunity Score Template)
Screening
There are two aspects to screening:
- Ensuring a representative sample: Screen out participants who do not perform the Jobs in the survey. Use your defined Job Performer to make this determination.
- Identify segments: Gain deeper insights into user needs and behaviors across different groups
A note on segmentation
To establish segments, we screen on these factors;
- Organization size
- Sector
- GitLab License
- GitLab Version
The goal is to receive a minimum of 50 responses per segment. In some cases, this may be unachievable in a reasonable timeframe. If this is the case for your Domain, then try to achieve 100 total responses, with 50 being the absolute minimum.
💡 Note: Remember to recruit both GitLab and non-GitLab users.
You may refer to our sample screener if you need more guidance.
Question Structure
Questions are structured in the survey following a precise method to reduce survey fatigue (see the example below). It is critical that you do not deviate from this or you may risk a low completion rate.
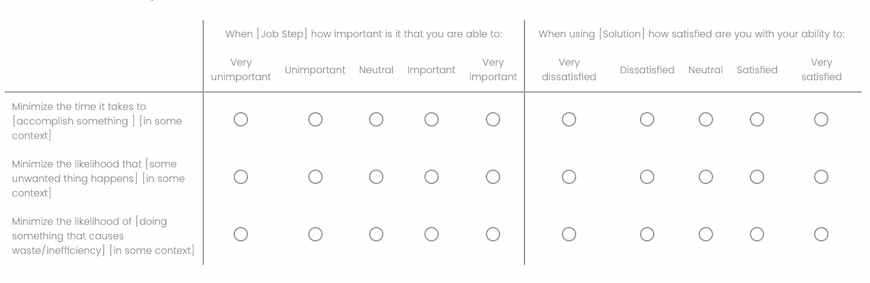
Scoring
You will find everything you need to score your results with this Outcome scoring template.
The results of the Outcome survey are scored using the top-two box method, which is intended for use in surveys where participants are asked to rate their level of importance and satisfaction across a scale. This is the same method we use for CSAT. Refer to the example below for more details.

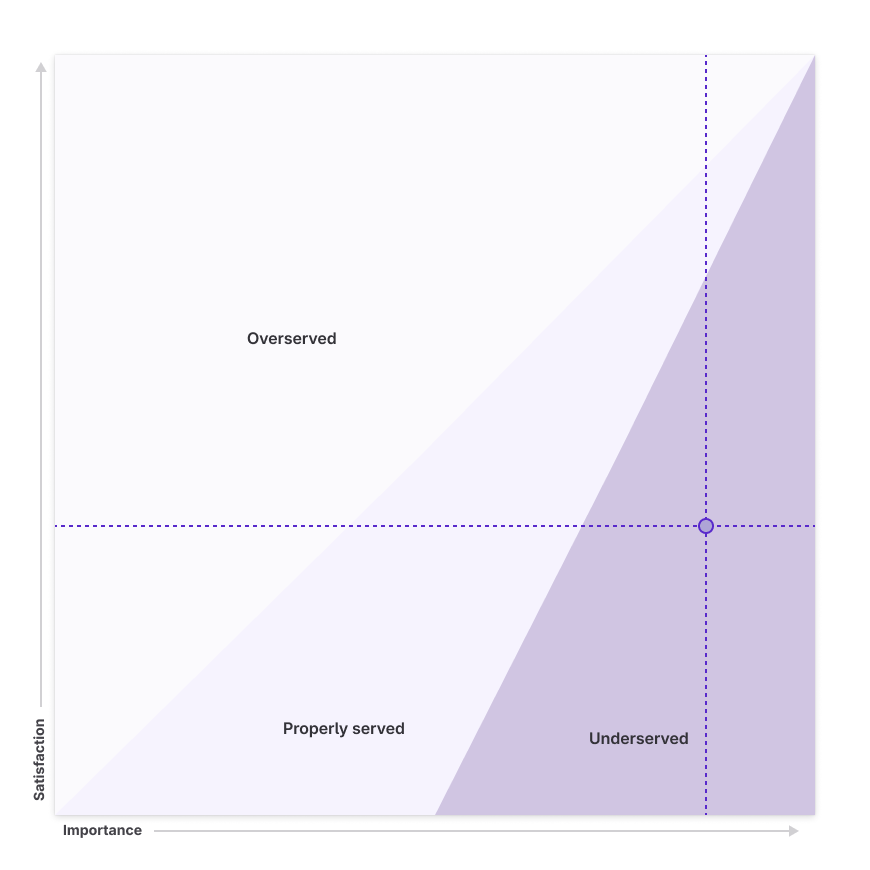
Looking at the example data above, we see that (40) or 80% of the total (50) participants find the [Job step] important, and 30% of participants are satisfied with the current [Solution]. We can plot these scores as data points to understand further how this correlates to Needs. To achieve this, we move the decimal (0.8 is now 8, and 0.3 is now 3). Looking at the diagram below, we find that this Outcome is an Underserved need.
Design evaluation
With an established benchmark, evaluating future designs becomes a much simpler process. The goal of a new design is to increase satisfaction, measured using an abridged version of the benchmarking Outcome survey. This is accomplished by taking every Outcome from the Job Step(s) you are designing within and asking the satisfaction questions with a short survey in a moderated or unmoderated session. You will want at least (10) participants to ensure you are moving in the right direction by improving the satisfaction score.
Alignment with UX Heuristics
The three dimensions of Speed, Reliability, and Efficiency directly correlate with GitLab’s UX Heuristics. Due to this alignment, it is not necessary to evaluate designs for each of these elements independently. Instead, using this framework, the ideal scenario for Job Performers involves instant task completion, 100% reliability, and 0% efficiency loss. Such perfection facilitates progress and fulfills needs.
| UX Heuristic | Speed | Reliability | Efficiency |
|---|---|---|---|
| Visibility of system status | — | ✅ | — |
| Flexibility and efficiency of use | — | — | ✅ |
| User control and freedom | — | ✅ | ✅ |
| Error Recovery | — | ✅ | ✅ |
| Real-time user interface | ✅ | — | ✅ |
| A tool the whole team can use | — | — | ✅ |
| Minimal setup required | ✅ | — | ✅ |
| Documentation is easy to use | — | — | ✅ |
| Features communicate the problem being solved and value to a new user | ✅ | ✅ | ✅ |
| Features / workflows have clear calls to action | — | ✅ | ✅ |
| Tasks are easy to learn and/or have setup support / guidance | — | ✅ | ✅ |
9b1952da)
