Data Science Project Development Approach
Our Approach
The Data Science Team approach to model development is centered around GitLab’s value of iteration and the CRISP-DM standard. Our process expands on some of the 6 phrase outlined in CRISP-DM in order to best address the needs of our specific business objectives and data infrastructure:
graph
    A[Requirements Gathering]
    B[Review of Prior Analyses]
    C[Review Data Sources and Exploratory Data Analysis]
    D[Feature Engineering]
    E[Modeling & Implementation Plan]
    F[Train MVP Model]
    G[Present Model Results and Insights to Stakeholders]
    I[Operationalize Model]
    J[Model Monitoring]
    K[Project Retrospective]
    A --> B
    B --> C
    C --> D
    D --> E
    E --> |Iterative| C
    E --> F
    F --> G
    G --> I
    I --> J
    J --> K
    K --> A
-
Recommended check-ins with stakeholders/project owner at the following phases, at minimum, to ensure project is on target for achieving project objectives:
- Requirements Gathering
- Modeling & Implementation Plan
- Present Model Results and Insights to Stakeholders
-
For defintions of some of the terms used, please refer to Common Data Science Terms. For definitions around sizing, please see T-Shirt Sizing Approach.
-
Create a new issue using the Data Science Process Template
1: Requirements Gathering
Sizing: Small (with on-going refinements through Implementation Plan Phase)
Purpose: This is perhaps the most critical phase in any data science project. Often a stakeholder will have a general idea of the problem they want to solve and you will need to help them define and refine the scope the of the project before beginning to develop a modeling and implementation strategy.
Tasks:
- Schedule kick-off call with stakeholders
- Questions to be answered during kick-off call
- What is the problem statement that is trying to be solved/answered?
- This often starts off as very generic question, e.g., “How can we reduce churn?”. It is our job to narrow in and clearly understand the population, outcome, and timeframe of the problem statement. For example, are we interested in all churning customers? How is churn defined? And over what period of time?
- Push the stakeholders to give as many specifics as possible. This may take several meetings and some data exploration to pin down. In some cases, there may not be clearly established definition and it will be up to the data scientist to create the definition during the EDA Phase.
- What do you hope to be able to achieve at the completion of this project?
- The intent of this question is to get at how this project can make a meaningful impact to the problem statement. Data science projects can increase the understanding of a problem statement (e.g. understanding churn risks), but they also should have a clear strategy for making actionable change to the problem (e.g. reducing churn). If a project is purely about understanding then it is probably not an appropriate scope for a data science project.
- Some good follow-up questions to this may be: “How do you envision the outcomes of this project to be used?”; “Who is the intended consumer of outputs from this project?”
- Has any analysis been done previously to try and address this problem/question?
- If prior analysis exists, this is a good indication that data exists to answer the question.
- Who is the best technical contact to work with on reviewing any prior analyses and data sources?
- What is the problem statement that is trying to be solved/answered?
- Schedule a reoccurring meeting cadence with stakeholders. This should probably be more frequent at first (i.e. weekly) and can then move to a less frequent cadence (i.e. every other week) as the project progresses
Considerations:
- Early in the conversation with the stakeholders it is critical to understand if the project is the appropriate scope for data science and if there appears to be the relevant data to answer the problem statement.
Completion Criteria:
- Project determined to be in the appropriate scope for a data science project
- On its face, it appears the data exists to answer the problem statement
2: Review of Prior Analyses (Optional)
Sizing: Small
Purpose: Understanding previous analytic work is essential for developing efficient and effective data science projects. By knowing the work that has already done we can identify useful data sources, outcome (target) definitions, potential predictors (features), nuances in the data, and important insights.
Tasks:
- Schedule a call with the DRI of the prior analytics work
- Understand what data sources were used (and why).
- Understand what data sources were considered but not used (and why)
- Also includes understand if there are any potentially useful data sources were not used (and why)
- Any technical/syntax definitions that should be used for this project.
- Links to any relevant code
- What were the key insights and takeaways from the analysis?
- Links to decks and/or documentation
- If the analysis was repeated today, what would the DRI to different (and why)?
Considerations:
- Prior analyses are generally help to review to avoid duplicating efforts and to have a base of knowledge to build from. Consider leverage pieces of the analysis code (if available) as part of the EDA and Feature Engineering Phases.
Completion Criteria:
- A solid understanding on the analysis based on the Tasks above
3a: Review Data Sources and Exploratory Data Analysis (EDA)
_Iterative with 3b & 3c*
Sizing: Large
Purpose: Review available relevant data and conduct analysis around the outcome/target and potential predictors (features). This will allow you to narrow in on the necessarily data sources to be used in the Train MVP Model phase. It is important to understand how your outcome/target relates to your potential predictor data and to set up the prediction timeframe appropriately.
Tasks:
- Understand if we have data available to measure the intended outcome/target of the project.
- This is the most critical element to establish before continuing. If we cannot quantify and measure the outcome, we cannot predict future instances of it.
- E.g. Churn requires an examination of historical revenue figures to determine when a customer reduced spend. Therefore, historical snapshots of ARR data would need to exist for a sufficient period in order to build predictions. As a general rule, at least twice the amount of historical data will need to exist as your prediction timeframe. For example, if you are predicting churn in the next 12 months, then at least 24 months of revnue data will need to exist (12 months for your prediction window and 12 months prior to that window to capture predictors/features).
- Determine if there are sufficient instances of the outcome/target that would make it reasonable to build a model on.
- A very, very general rule of thumb: At least 1,000 instances of the outcome/target
- Review all relevant data sources that you intend to use for modeling
- Do the data sources contain data from the time periods you are interesting in examining?
- Do the data sources contain sufficient coverage? That is, are there are lot of missing values or features with largely the same value for every row?
- What is the relationship (correlation) between the data and the outcome/target? If the relationship is too strong or too weak, it may not be a good candidate to include in the modeling phase.
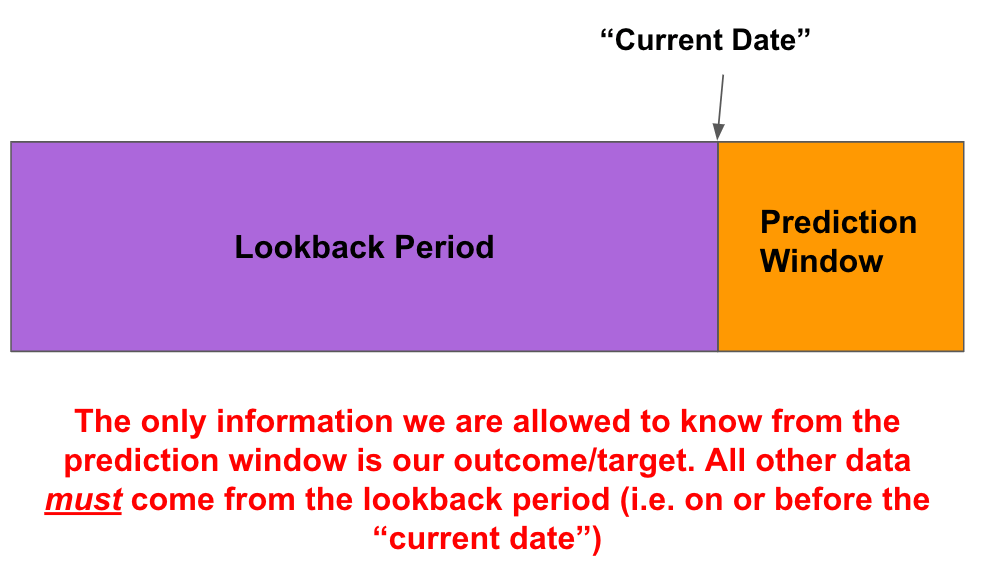
- Are there are potential risks for data leakage from the lookback window into the prediction window by using this data source?
Considerations:
- It is not necessary to go too deep into creating features at this phase. What is important is to get a sense if the data source will be useful and proper for modeling the outcome/target. It may also be helpful to start constructing the framework your ETL code (most likely SQL) during this phase.
Completion Criteria:
- Generate syntax for outcome/target and verify sufficient count exists for modeling
- Identify possible datasources and determine viability of each source for use in the project
- Perform exploratory data analysis
- Review results with stakeholders and collect feedback on appropriateness of:
- outcome/target definition
- data sources being used, reasons for inclusion/exclusion, and if any additional sources should be considered.
- Solicit feedback regarding fields that are being created as potential features of the model. Stakeholders may suggest addition datasources, features, or rollups that are not currently being considered.
- This will likely be an iterative process. As you uncover insights, it may unearth additional questions/comments/concerns from stakeholders.
3b: Feature Engineering
Iterative with 3a & 3c
Sizing: Large
Purpose: Based on the EDA, prior analysis, and knowledge about the problem statement, create a list of features in SQL using the tables outlined in the implementation plan that will be used to predict the outcome.
Tasks:
- Identify a list of features that will be constructed
- Identify which table(s) will be used to construct each feature
- Construct SQL code to build the model training dataset
- Parameterize your code so you can easily change time periods on the fly, and to make it possible to use one query for both training and scoring the model.
- Ensure that there is no leakage from your Prediction Window to your Lookback Period. For example, if your Prediction Window is data within the last 90 days, the feature data should only come from data at least 91 days in the past
- Ensure that your dataset is aggregated/rolled-up to the appropriate level. For example, if you are making a prediction about accounts, the output of your SQL code should be aggregated at the account level.
Considerations:
- Behaviors make for great features. The best predictors about future behavior are often past behaviors.
- Using historical data is a great way to create “change features”. For example, instead of just looking at license utilization from one point in time, you can construct multiple features to see how it has changed over time and capture the magnitude, direction, and acceleration of the feature.
- Eventually, the GitLab Data Science team will implement a feature store that will allow to easily creation and retrieval of features to be used for modeling.
- Using a standard naming convention for fields ensures that someone else is able to pickup the and understand the code easily. Consider using the suffixes
_cnt, _pct, _amt, _flagfor fields containing counts, percents, currency amounts, and boolean flags, respectively.
Completion Criteria:
- Generate SQL code that can be run in Snowflake to produce your modeling dataset.
- SQL Code can also be run in Jupyter/Python (this is a requirement for our production pipelines).
3c: Modeling & Implementation Plan
Iterative with 3a & 3b
Sizing: Medium
Purpose: Putting together a modeling plan will allow you to communicate to the stakeholders how you intend to answer their problem statement using data science. A plan should clearly layout any necessary definitions, data sources, methodologies, and outputs. Additionally, constructing a plan will allow for faster, smoother development in future iterations.
Tasks: In the project issue, document the following:
- A clear, concise, and easy to understand project name. E.g. Propensity to Churn
- Clearly defined and specific outcome/target that is being measured, both in plain English and in syntax. E.g. “Likelihood for a paid account to reduce Annual Reoccuring Revenue (ARR) by at least 10% in the next 12 months”. The definition should include the following elements:
- Population: e.g. Paid Accounts
- Measurable Outcome: e.g. 10% or greater reduction in ARR
- Timeframe: e.g. Next 12 Months
- Data sources to be used and specific date windows
- Brief overview of the modeling process, including algorithmic approaches that will be attempted: e.g. logistic regression, XGBoost, MARs
- Model Outputs: e.g. A propensity score (0-100%), top 3 local insights for each account, Inspector and Monitoring dashboards.
- Where the model outputs will reside (Snowflake, Salesforce, etc.) and the DRI for ensuring the source gets populated.
- Project timeline
Considerations:
- Does the definition of the outcome/target align with the intended purpose, outcome, and outputs of the project?
- Does the modeling approach allow you to produce the desired model outputs?
- Do the model outputs allow you to address the overall objective of the project?
Completion Criteria:
- Review plan with stakeholders and modify as necessarily based on feedback.
4: Train MVP Model
Sizing: Large
Purpose: Using the dataset created in the previous stage, prepare, model, and glean insights that directly address the problem statement.
Tasks:
-
Conduct a data gut-check to make sure the data looks proper:
- Naming conventions are consistent
- Field types look correct (e.g. numeric fields are formatted as numeric)
- Distribution/Min/Max/Mean/SD look reasonable
- NULLs for features we expect to have nulls
- Zero-fills for features we expect to have zero
- Coverage: are there features where wthere is not a lot of variation (e.g. mostly zero). If so, you may want to consider creating
_flagfields for those features instead.- Do you notice any clear distinctions between different subsets of modeling population (e.g. Free vs Paid accounts). If so, it may make sense to split into more than one model if those features are highly predictive of the outcome.
- Based on the above analysis, does it make sense to create a different view of the potential features (change to bands/deciles/quartiles/etc)?
-
Model prep: may include the following components:
- Outlier detection
- Missing fill
- Dummy coding and indicator creation
- Removing features due to low variation, multicollinearity, high correlation to the outcome, etc.
- Check logic for possible data leakage
- The Data Science team has created the gitlabds python package to assist in many of these data prep tasks. If you’re using the data science jupyter container, this package is already installed.
-
Model iteration
- Logging model training runs/experiments. The Data Science team is currently implementing MLFlow to track model training iterations. More details will be shared when it is available
-
Final model candidate selection
Considerations:
- If you would like to use the Data Science Team model production process (see Phase 6), your code will need to be able to execute on the data science jupyter container. Therefore, it is recommended that you use this container to train your model.
- If your model requires packages that are not installed on the data-science repository, please raise an issue with the Data Science team, and we will add them.
- The Data Science team has a number of tools and resources to assist you in this process. Visit the Data Science Handbook page for additional information. These include:
- Pre-Configured JupyterLab Container
- gitlabds python toolset
- Modeling Process Templates
- Sometimes it’s a good idea to build a baseline model that represents the status quo so that there is a tangiable solution to compare the model against.
Completion Criteria:
- Test/Validation sample shows high predictability, good discrimination, and low variation compared to the train sample,
- Model lift is monotonic and deciles are roughly equal
- MVP model tells an interesting story based on the predictors (features) present in the model
- One or two predictors are not accounting for the majority of the predictive power of the model
5: Present Model Results and Insights to Stakeholders
Sizing: Medium
Purpose: Synthesize the findings from your model and report back to the stakeholders.
Tasks:
- A presentation should a include the following elements:
- Problem statement and how the model is solving for it.
- Timeline (where we are in the project)
- Data sources used/considered
- (Optional) Very high-level methodology
- Key features
- How we know it’s a good model (e.g. performance metrics, lift)
- Model limitations
- Conclusions
- Next steps
Considerations:
- Although data scientists spend a lot of time (and are excited about!) compiling datasets and iterating over model training runs, that information is best left out of a presentation to stakeholders. Try to keep the deck as non-technical as possible. Any technical information, if desired, can be put into an appendix.
- Same goes for methodologies. It is recommended to limit methodologists to one slide – mostly so we have documentation of what was done for the project and not because most non-data scientists care :upside_down:
Completion Criteria:
- Sign-off from stakeholder that the model is an acceptable solution to the problem. This may take several iterations.
6: Operationalize Model
Sizing: Medium
Purpose: In order to score a model independently of a training run – and on data outside of the training time period – we need to operationalize a scoring process and add it to the data science production pipeline
Tasks:
- Place all your model parameters into a scoring parameters yaml file.
- Create a new scoring notebook.
- Create a scoring jupyter notebook (a python script also works)
- Create any hard-codes that are necessary. For example, if you performed outliers for training, use those values in your scoring code (as opposed to calculating new outliers on your scoring dataset)
- Create dummy codes for any dummy-coded features in your model
- Make sure you are completing all the same model prep steps in the scoring score as you did in the training code.
- Once you have your scoring notebook ready, a good way to check for errors is to run your training dataset through it. You should arrive at the same model score descriptives and decile breakdowns as you did in your training code.
- If the numbers are not aligning up, it is most likely due to an issue with your scoring code. The best way to check this is to look at the descriptives of the features. Look at the descriptive right before they get scored in the training code and in the scoring code. If one or more features are off, then you have most likely located the issue.
- Now you can run your code with your scoring dataset. Be sure update your sql code so it is parameterized to use the most current data available.
- Examine the model decile distribution of your scored records. They should be roughly equal. If they are wildly off, or if they vary widely in each scoring run, it could be a sign that your model is overfit/underfit and cannot generalize beyond the training dataset.
- Add .sql file, parameters.yml, model artifacts, and jupyter notebook to a production directory in your repo.
- Create a new issue using the Scheduling Notebook Request template, follow any additional steps, and tag
@gitlab-data/engineerswhen ready to operationalize
Considerations:
- This step is prone to a lot of human error, so completing the tasks outlined above is helpful to ensure accurate scoring of the model.
- What is the scoring cadence (Daily/Weekly/Month)? Batch or real-time?
- real-time scoring will likely have different technological requirements than batch scoring.
Completion Criteria:
- When scoring code is run on the training dataset, the score descriptives are identical to what was observed during training
- Scoring data is set to use the most currently available data
- Model deciles are in rough alignment to what was observed in training
- DAG is created for the model pipeline and score populate appropriately
7: Model Monitoring
Sizing: Medium
Purpose: The purpose of setting up dashboards for your model are two-fold: 1) Monitor model performance and lift “in the wild” and; 2) Provide an easy point of access to end-users to consume and understand model outputs. As we migrate to a new data visualization and data observability tools, we hope to streamline, automate, and simplify creating model dashboards.
Tasks:
- Create an “Inspector” dashboard that is targeted towards end-users/consumers of the model outputs.
- Create a “Results” dashboard to track model performance over time.
Considerations:
- This process will hopefully become more streamlined as we shift to a new analytics visualization solution
Completion Criteria:
- Creation and sign-off of dashboards
8: Project Retrospective
Sizing: X-Small
Purpose: The purpose of the retrospective is to help the data science team learn and improve as much as possible from every project.
Tasks:
- Create retrospective issue.
- Invite and solicit feedback from everyone involved in the project (stakeholders, contributors, etc.). Specifically, we want to know:
- What praise do you have for the group?
- What went well with this project?
- What didn’t go well with this project?
- What can we improve going forward?
Considerations:
- Make sure issue is private (confidential) to the data group, plus anyone else who worked with the group during the project, to ensure everyone feels comfortable sharing freely.
Completion Criteria:
- Gather feedback , synthesize learnings, and close the issue.
46417d02)
