Tableau Developer Tips and Tricks
Date Handling
Tableau has many ways for handling and visualizing dates - but due to those many options, it can be handy to have some tricks for the best way to do it, especially if you have custom needs.
Date Handling in Production Dashboards
Due to the unique challenges of having a fiscal year start date in February and missing fiscal year date calculations in Tableau, we have developed simple date handling guidelines that can expedite and simplify the process of date filtering and creating date axes for charts. We have created a workbook that contains all of the following calculations and joins and some sample data. This can be found in the Resources folder, under the name Developers Guide Example Workbook.
Date Unification
If you have more than one data source in your workbook, the first thing to do is to unify the dates around a date spine. This means using a calendar table. If you are at GitLab, you can find the dim_date table in the common schema of the prod database. Join each of the tables that you need to use to the dim_date table on the date you want to use for the date spine using dim_date.date_actual = your_table.your_date. Click here to see documentation on the dim_date table.
Even if you are not using multiple tables/ dates, it is still recommended to use the dim_date table, because it contains useful information about dates which can be used for filters and controls. For example, if you wanted to use a standard filtering method of comparing the quarter of a date with today’s date to filter out any data from a previous quarter, you might use:
Current Period: DATETRUNC('quarter',Date Actual) = DATETRUNC('quarter',TODAY()).
However, this will truncate your data down to the non-fiscal quarter, such as truncating 11/11/23 down to 10/1/2023. This will lead to incorrect fiscal sorting and filtering of data. Using the dim_date table, however, allows you to use the following calculation:
Current Period: [First Day of Fiscal Quarter] = [Current First Day of Fiscal Quarter]. This is far simpler than the alternative without a date table, which would include a series of DATEADD and DATETRUNC calculations thoughtfully stacked on top of each other.
Adding a Report Date
Many times, end-users would appreciate being able to change “today” in their reports. For example, they may want to be able to view a report as of the last day of the previous quarter. The addition of a date parameter called report date can improve your user experience in this area. However, this creates issues when you need to compare your report date to your date_actual from the calendar table, because you do not have the built in date information for your report date that you do for the date_actual field. Here is what the parameter creation looks like: 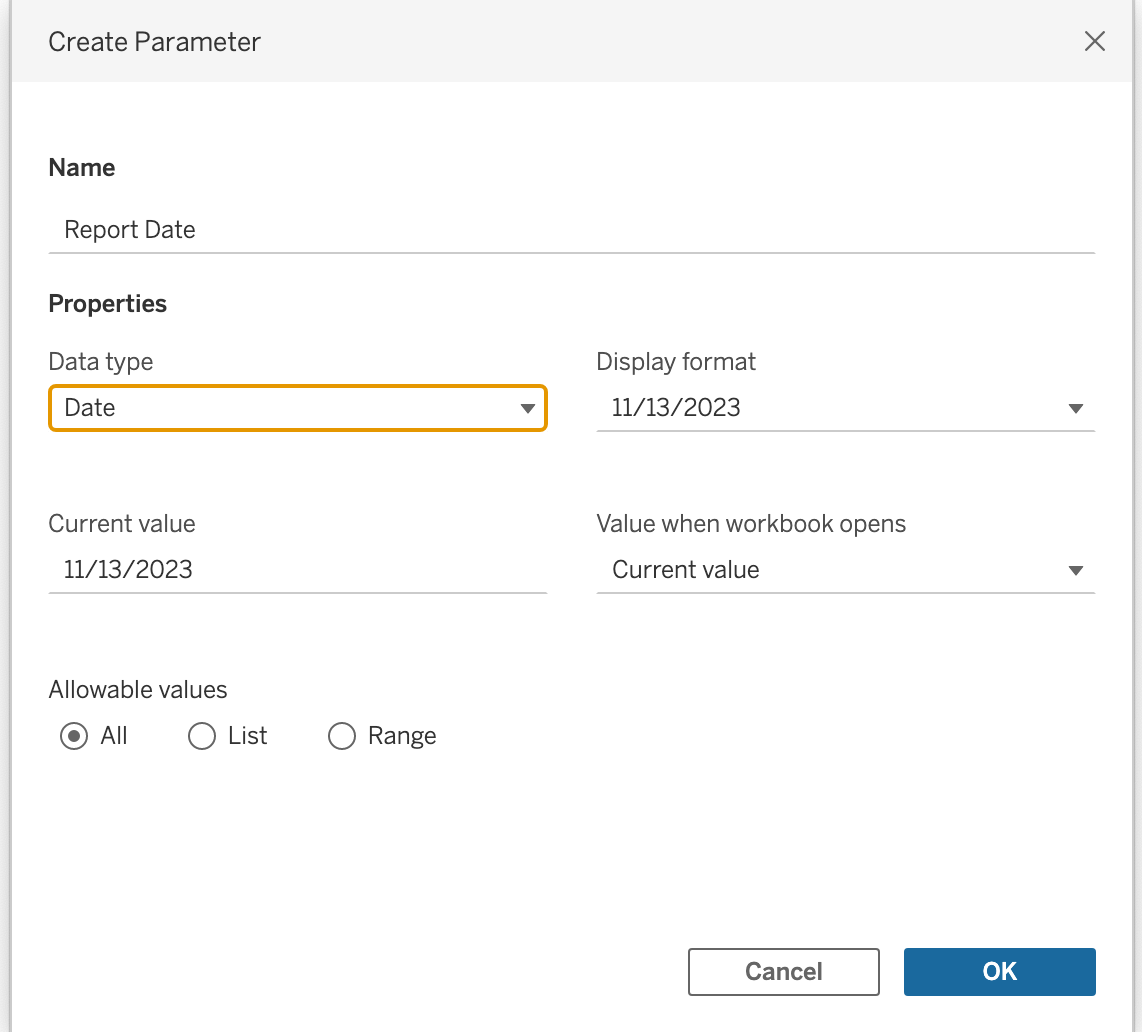
There is a simple fix to this issue, which is similar to how Row Level Security works (which can be found later in thie guide). To add date information such as Fiscal_quarter_name and First_day_of_fiscal_quarter for the Report Date parameter, follow the following steps to re-join and then filter a second iteration of the dim_date table onto the regular data model.
Create a New Dim_Date Table
-
First, open up your Data Source pane in your workbook and in the left-hand connections bar and navigate to the
dim_datetable.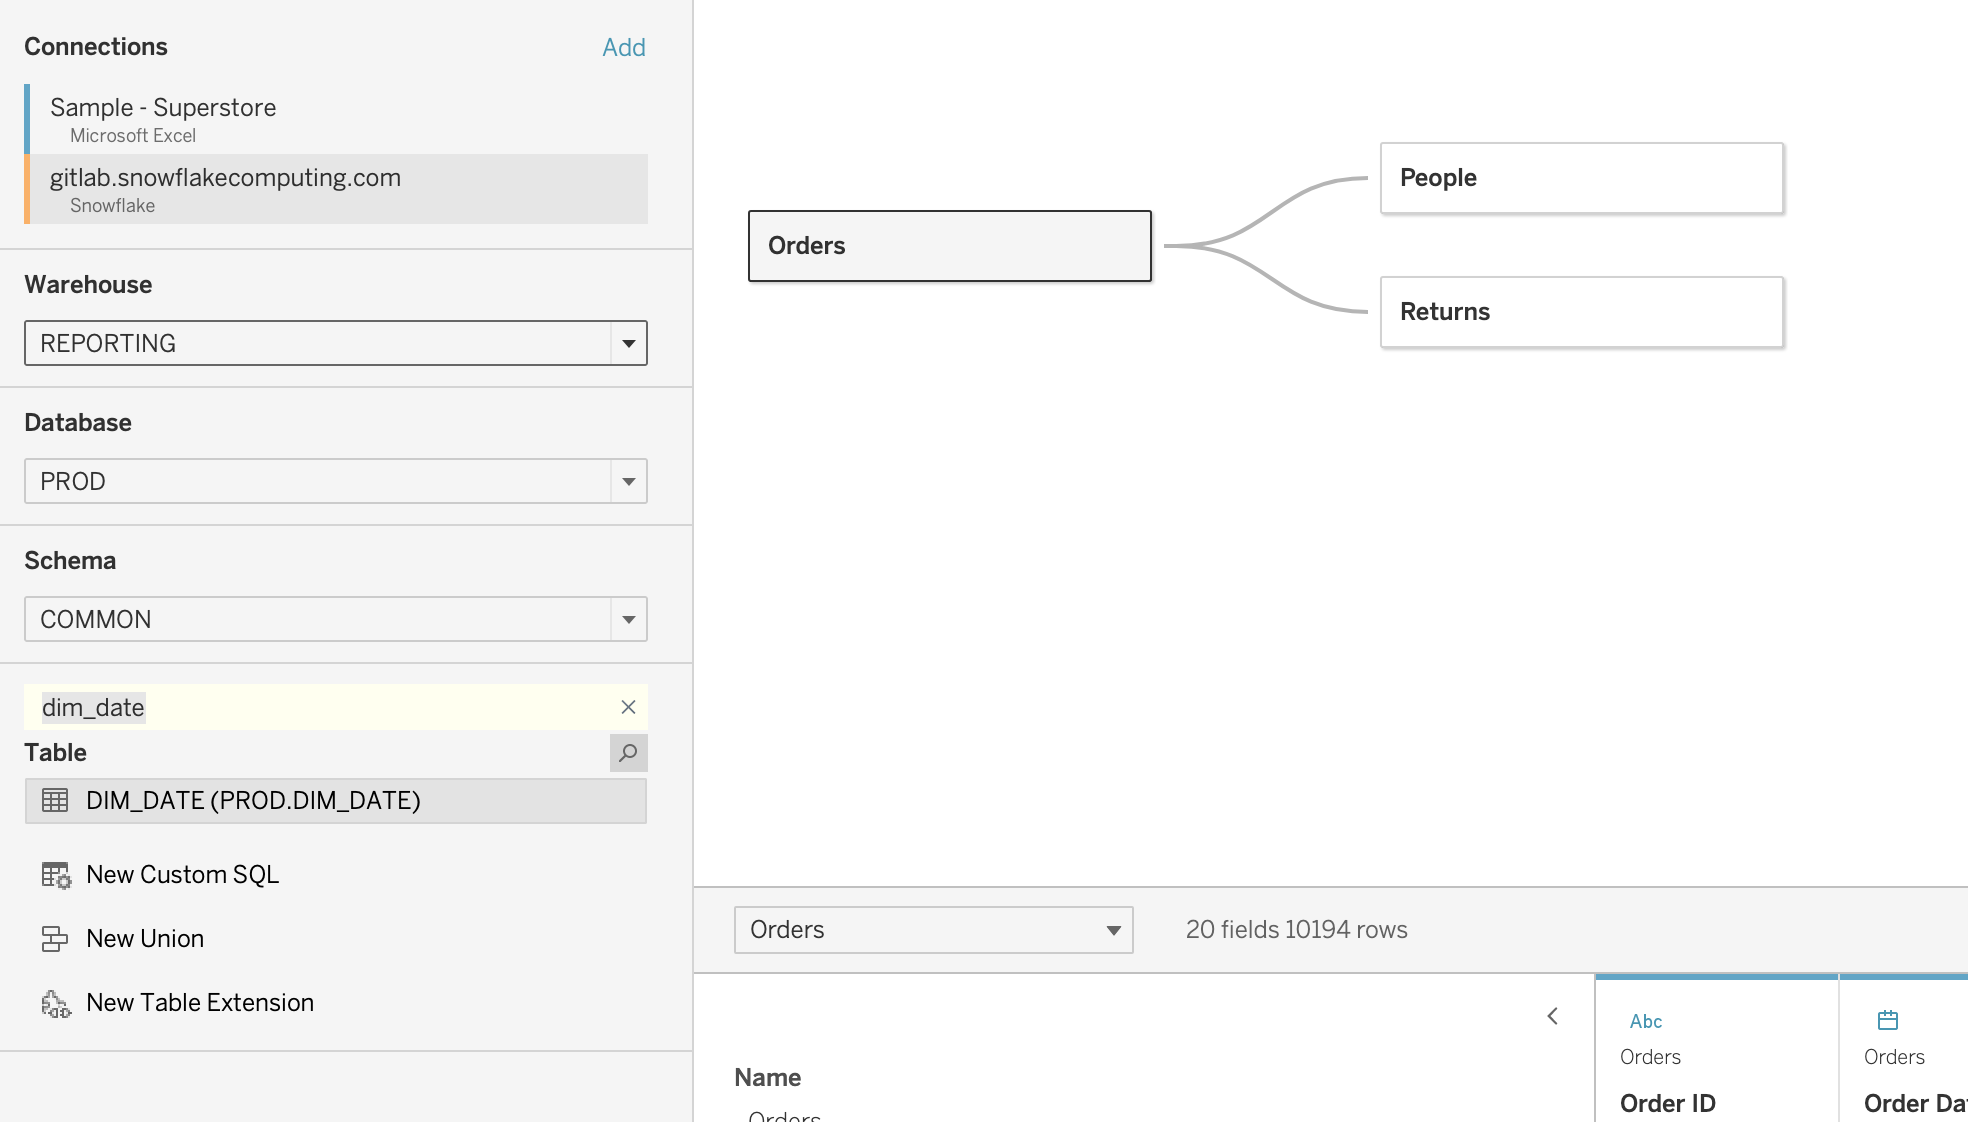
-
Add
dim_dateto the data model, you can use a relationship, but make sure to join it to the same table that contains your primary date information (such asdate_actual). Tableau will automatically name the new tableDIM_DATE1. You need to create a relationship (or join if you choose to use a physical join) that will evaluate as true all the time. Since you are working with a limited number of date fields, one option is to use yourFirst_Day_of_YearandLast_Day_of_Yearfields. -
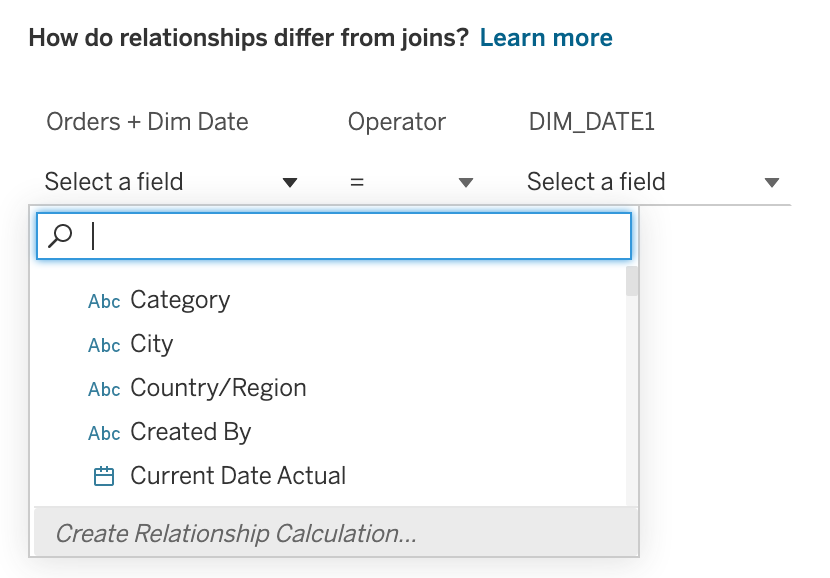
To create a custom relationship calculation, click on the noodle that connects the two tables, and in the dropdown where you would normally select the field, click on the bottom where it says “Create Relationship Calculation”
-
Use the calculation
MONTH([First Day Of Year]) <= MONTH([Last Day Of Year (Dim Date1)]). Anecdotally, you may experience slightly better performance if you add a second line that is just 1 = 1. Without creating a new column in the source tables, you cannot just use a custom calculation of 1 = 1 on its own. It should look like this: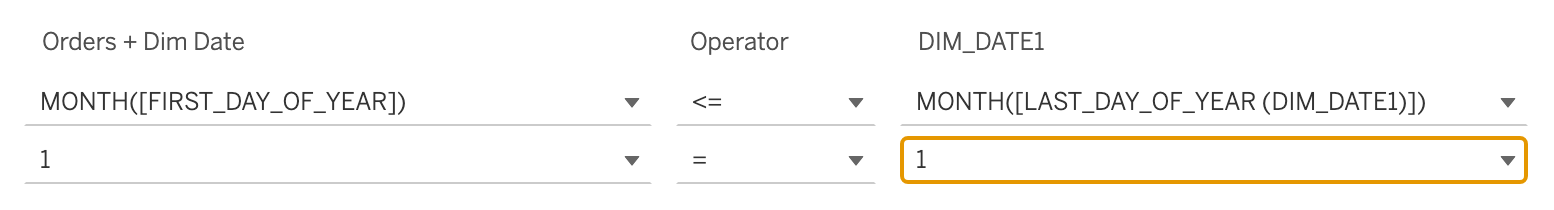 Be very careful that you use the first and last days of the year in this calculation, not the first and last days of the fiscal year.
The purpose of the MONTH([First Day Of Year]) <= MONTH([Last Day Of Year (Dim Date1)]) calculation is that it will evaluate as true every time, no matter what filters are applied. This is true of the additional 1=1 methodology. This ensures that the report date information you are creating will be added to every row of data in the dataset, allowing you to access the Report Date parameter information at any time. It works similarly to a cross-join in SQL.
-
You now have two
dim_datetables, but you only want one row of information from the second table. Next, we will create a filter that will filter theDIM_DATE1table down to just one row of data- the data the corresponds to the Report Date which you (and your end-user) have selected. -
Click out of the Data Source pane and into a blank sheet of the workbook. Create a new calculation that you can use later to filter your table and call it Report Date Filter:
[Date Actual (Dim Date1)] = [Report Date]. Do not apply it to your worksheet - you will use it elsewhere. -
Return to your Data Source Pane, and find the “Add” button under the “Filters” heading, in the top right corner.
-
Select “Add” and “Add” again, and a pop-up will give you your choice of field to select. Search for the “Report Date Filter” field and select it. On the next window, select “True” and hit “ok”. You should now see this filter in your Data Source Filters list. Hit ok. !]](images/image-5.png)
-
Open a sheet of the workbook, and test to see if your filter worked. If it worked, you should see that for every
Date Actualin the data set, there should be just one value for theDate_actual1from theDIM_DATE1table.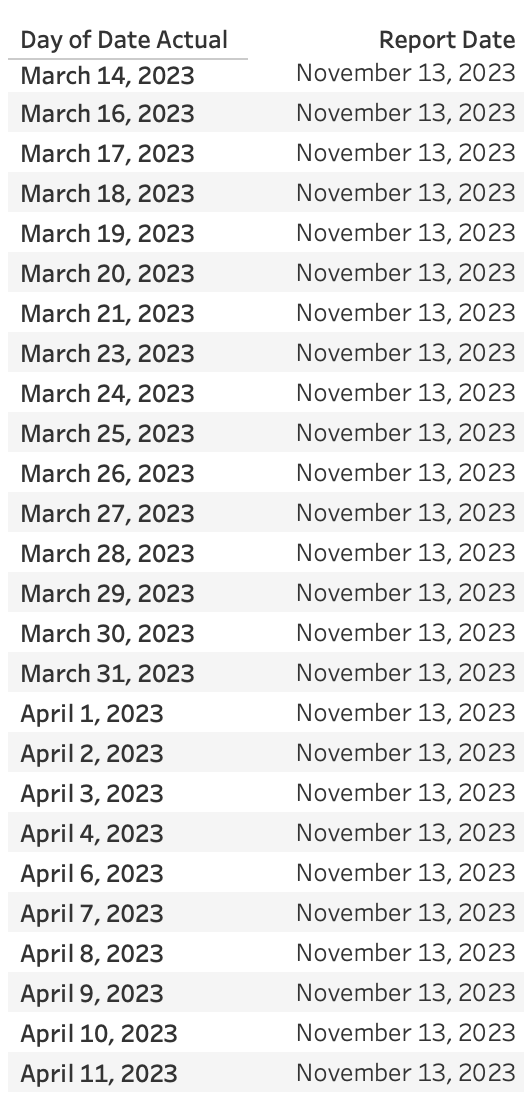
-
If you are using a live connection, you are ready to go. You and your end-user can switch the date of the reprort date as needed, and the dim_date1 table will update accordingly each time.
-
If you are using an extracted data connection, there is one more important step. Before publishing these changes, you need to make sure that the data extract will include the information that you and your end-user would need if you changed the report date. Referring to Tableau’s order of operations, the filter on the data needs to come after the Extract Filter, or the extract will not include any data for dates other than the one selected when it extracts. This means that the filter needs to be a Data Source filter only. By default, Tableau may add your Data Source filter to the Extract Filters list.
-
In the Data Source Pane, in the area where you select between a Live and Extracted connection, select “Edit”. You will see that under the filter list,
Report Date Filteris selected and keeping only true. Click on that, and select Remove. Then hit ok.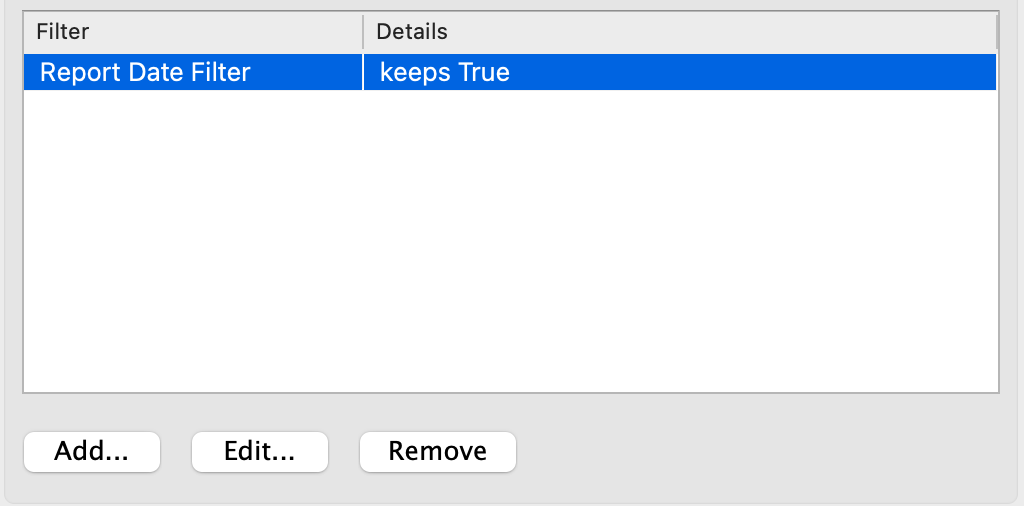
-
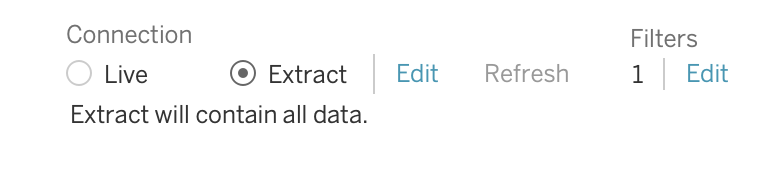
Notice that your extract will contain all data, but under “Filters”, it has the number 1. This means that you have removed the extract filter, but kept the data source filter.
You can now leverage the full dim_date table for filtering and sorting your data! You may wish to rename fields from the Dim_Date1 table to make it more clear that these fields are specific to the Report Date. You can also optionally hide any unneeded columns, such as anything from the Dim_date1 table relating to the “Current Date”.
Axis Dates
In Tableau, you can customize your Fiscal Year Start Date of any date field. 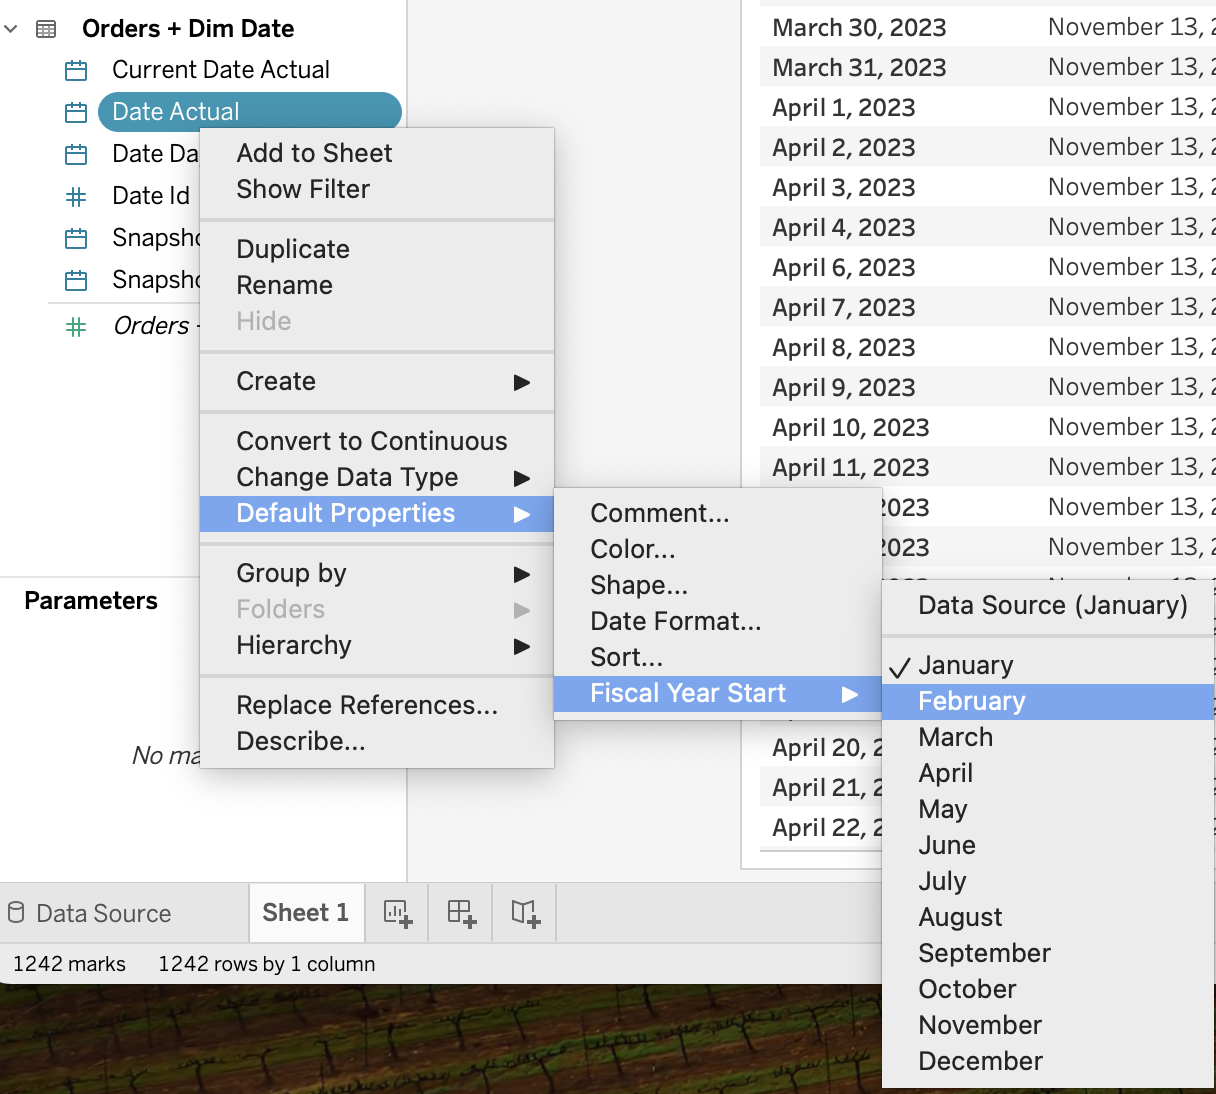
However, this is not a foolproof solution. There are many instances where using a string date on the axis of bar and line charts will be much more effective than using native date fields. For example, if you want to create a simple discrete bar chart but allow your end-user to switch between monthly, quarterly, and yearly data, there is no straightforward way to do that in the same sheet. Normally you would need to create a “sheet swapper” on your dashboard, and selectively show or hide certain sheets based on which date granularity is desired.
Instead, you can create one date axis which automatically updates depending on your date granularity. Assuming you have already joined dim_date to your data model, take the following steps.
- Create the Select Time Period Parameter.
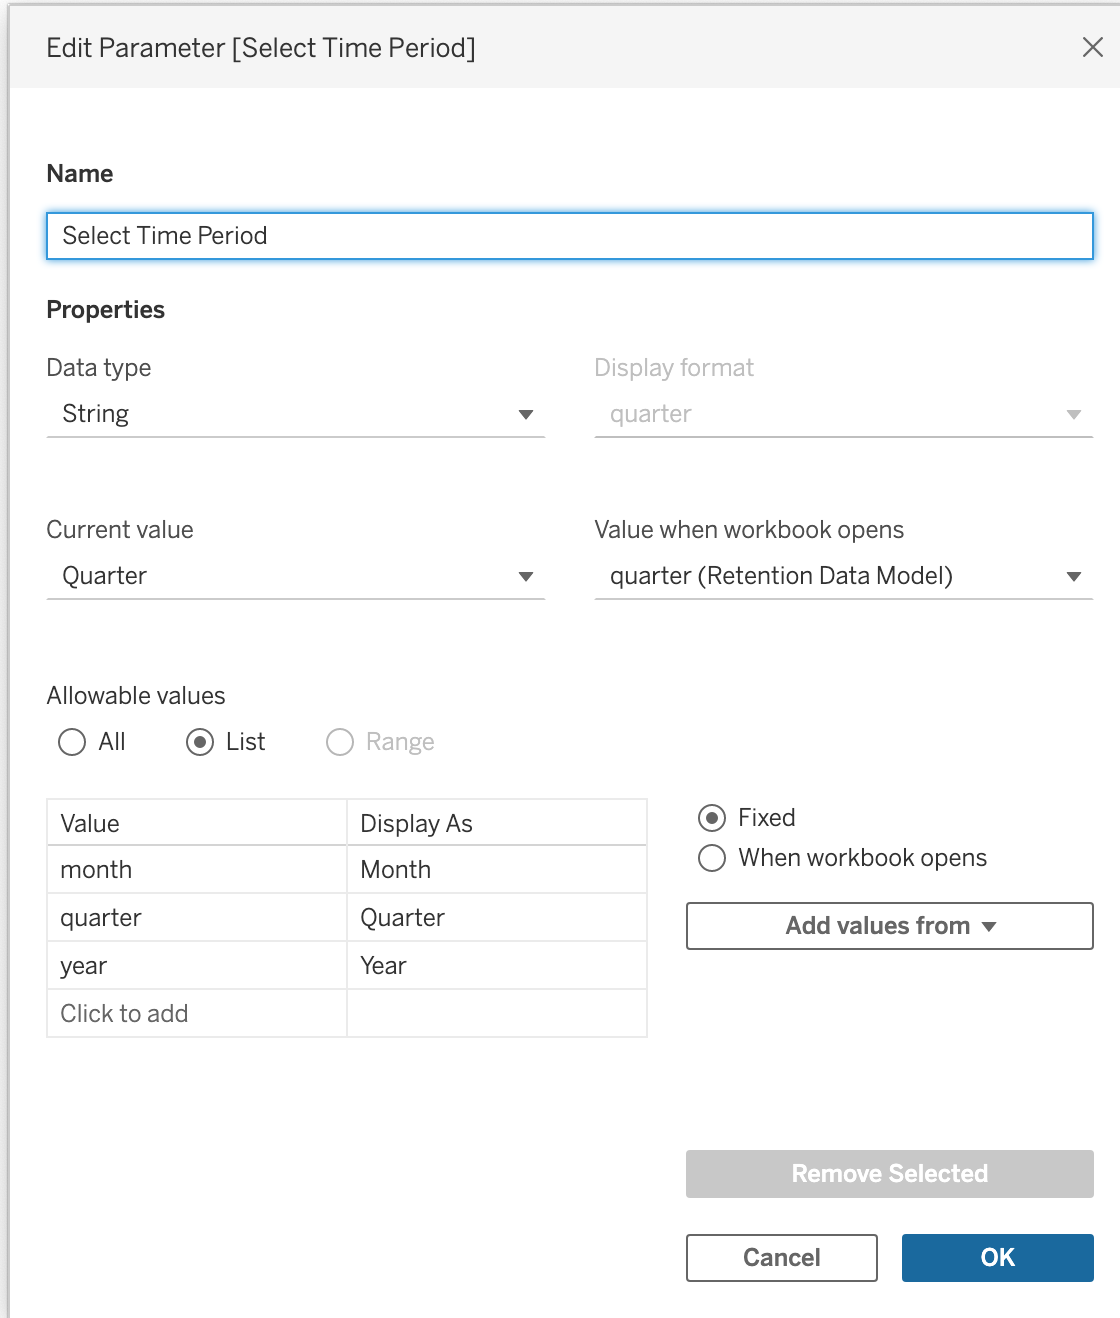
- Use the following code in a calculated field called Axis Dates:
Axis Dates
IF [Select Time Period] = 'year' THEN
    "FY " + STR([Fiscal Year])

ELSEIF [Select Time Period] = 'quarter'
    THEN [Fiscal Quarter Name Fy]

ELSEIF [Select Time Period] = 'week'
    THEN STR([Fiscal Year]) + "- " + STR([Week Of Fiscal Quarter Normalised])

ELSE //STR([Fiscal Year]) + "- "+
STR([Fiscal Month Name])
END
-
You now have a simple date axis which you can use with bar charts and line charts.
-
One issue you may encounter, however, is that the dates will sort themselves alphabetically. If you are using the
dim_datetable, there is a simple solution to this as well. There is a field calleddate_idin the dim_date table which gives every day a unique id, counting upwards. So the date_id of tomorrow will always be one greater than today. -
Bring the
Axis Datesfield out onto Rows or Columns, and then access the Sort option by right clicking on the field and finding “Sort…”. Then change the default to sort “By Field”, find “Date id”, and then use an aggregation such as “Average”.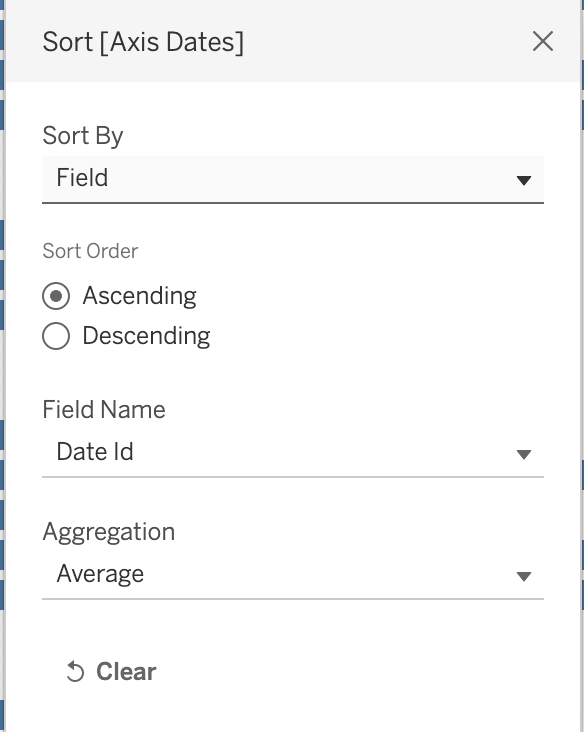
Now you have a date axis which will dynamically allow you and your end-user to switch between date granularities on the same worksheet, while maintaining maximal control over the way the view looks and functions.
Date Filtering
The addition of a Dim_Date table and consideration of a dynamic date axis creates an opportunity to use dynamic date filtering. A date filter can be created by leveraging the dim_date table with the Select Time Period parameter.
To create this date filter, you will need to create one more parameter for end-user input, or simply decide on a date range that you want the fix the filter to. If you create a Date Interval parameter which can be placed on the dashboard, then the end-user has control on how many periods they want to see at a time on time series graphs, such as bar and line charts. 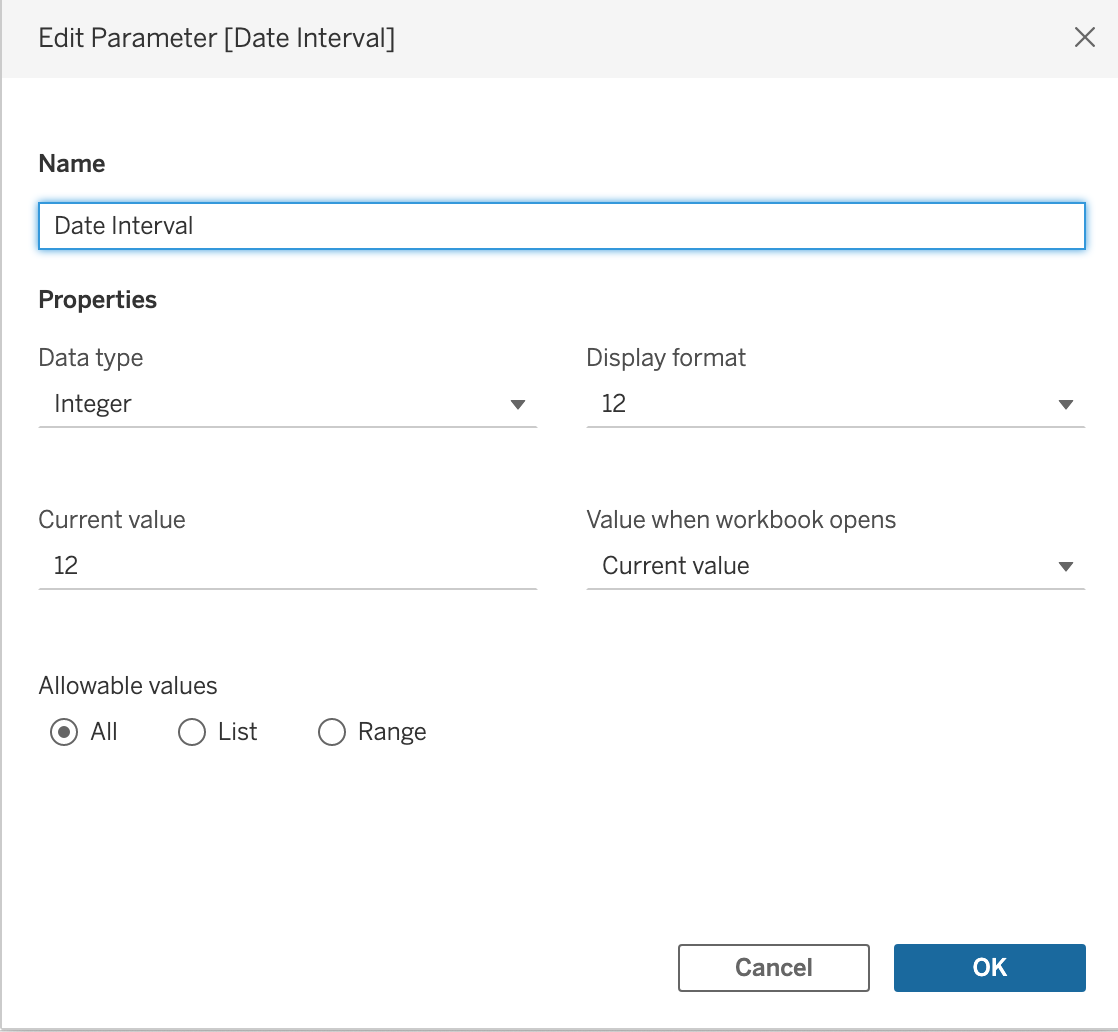
Once you have done so, the following dynamic date filter will work to filter the data:
Date Filter - Dynamic
IF [Select Time Period] = 'month' THEN
    DATETRUNC('day',[Date Actual]) <= DATETRUNC('day',[Report Date])
        AND  DATETRUNC('month',[Date Actual]) > DATEADD('month', -[Date Interval], DATETRUNC('month',[Report Date]))

ELSEIF  [Select Time Period] = 'quarter' THEN
    DATETRUNC('day',[Date Actual]) <= DATETRUNC('day',[Report Date]) // earlier than report date
        AND
    DATETRUNC('month',[First Day Of Fiscal Quarter] ) > DATEADD('month', (-[Date Interval]*3), DATETRUNC('month',[First Day Of Fiscal Quarter (Dim Date1)]))

ELSE
    DATETRUNC('day',[Date Actual]) <= DATETRUNC('day',[Report Date])
        AND
    [First Day Of Fiscal Year] > DATEADD('month', -[Date Interval]*12, [First Day Of Fiscal Year (Dim Date1)])
END
Current and Previous Period Calculations
To add onto the date filter, if you create T/F fields called Current Period and Previous Period, then you can use these in conjunction with measures and dimensions to create fields such as Current Period Sales. This can then be used in Tooltips, Big Numbers, to create fixed Period over Period fields, and for analytics lines.
There are two ways to create these calculations. The first option is to cut the data off at the current day of the fiscal period (month/quarter/year), so that you are comparing the time periods evenly. For example, comparing the first 13 days of this quarter to only the first 13 days of lasrt quarter. This is what these calculations would look like:
Fiscal Date Filters
Is Fiscal Period to Date Dynamic
IF [Select Time Period] = 'year' THEN
 [Day Of Fiscal Year] <= [Day Of Fiscal Year (Dim Date1)] // Cuts data off at the day of the report date


ELSEIF [Select Time Period] = 'quarter' THEN
    [Day Of Fiscal Quarter] <= [Day Of Fiscal Quarter (Dim Date1)] // Cuts data off at the day of the report date

ELSE
[Day Of Month] <= [Day Of Month (Dim Date1)] // Cuts data off at the day of the report date

END
Current Period
IF [Select Time Period] = 'year' THEN
    [First Day Of Fiscal Year] = [First Day Of Fiscal Year (Dim Date1)] // in the same year
            AND DATETRUNC('day',[Date Actual]) <= DATETRUNC('day',[Report Date])  // Cuts data off at the day of the report date

ELSEIF [Select Time Period] = 'quarter' THEN
    [First Day Of Fiscal Quarter] = [First Day Of Fiscal Quarter (Dim Date1)] // in the same quarter
            AND DATETRUNC('day',[Date Actual]) <= DATETRUNC('day',[Report Date])  // Cuts data off at the day of the report date

ELSE
DATETRUNC('month',[Date Actual]) = DATETRUNC('month',[Report Date]) // in the same month
            AND DATETRUNC('day',[Date Actual]) <= DATETRUNC('day',[Report Date])  // Cuts data off at the day of the report date

END
Previous Period
IF [Select Time Period] = 'year' THEN
    [First Day Of Fiscal Year] = DATEADD('year',-1,[First Day Of Fiscal Year (Dim Date1)])
            AND [Is Fiscal Period To Date Dynamic]


ELSEIF [Select Time Period] = 'quarter' THEN
    [First Day Of Fiscal Quarter] = DATEADD('month',-3,[First Day Of Fiscal Quarter (Dim Date1)])
            AND [Is Fiscal Period To Date Dynamic]

ELSE
DATETRUNC('month',[Date Actual]) = DATEADD('month',-1,DATETRUNC('month',[Report Date]))
AND [Is Fiscal Period To Date Dynamic]// Cuts data off at the day of the report date

END
The other option is to take the total current and previous periods. These calculations will look like the following:
Current Period (Total)
IF [Select Time Period] = 'year' THEN
    [First Day Of Fiscal Year] = [First Day Of Fiscal Year (Dim Date1)] // in the same year

ELSEIF [Select Time Period] = 'quarter' THEN
    [First Day Of Fiscal Quarter] = [First Day Of Fiscal Quarter (Dim Date1)] // in the same quarter

ELSE
DATETRUNC('month',[Date Actual]) = DATETRUNC('month',[Report Date]) // in the same month

END
Previous Period (Total)
IF [Select Time Period] = 'year' THEN
    [First Day Of Fiscal Year] = DATEADD('year',-1,[First Day Of Fiscal Year (Dim Date1)])


ELSEIF [Select Time Period] = 'quarter' THEN
    [First Day Of Fiscal Quarter] = DATEADD('month',-3,[First Day Of Fiscal Quarter (Dim Date1)])


ELSE
DATETRUNC('month',[Date Actual]) = DATEADD('month',-1,DATETRUNC('month',[Report Date]))


END
A use-case you may find for using each of these on the same sheet is when you want to get information about your Actual Sales up until the Report Date this quarter, but you want to compare those to the Total Sales Target for the quarter - so filtering all of the data to stop at the report date would result in an incomplete target.
Additional Tricks
These tricks are non-essential to this method of date handling, but might help you improve the UI of the workbook, or at least save time with creating filters.
Non-additive or Semi-additive Data
This tip is less straight-forward, but has been tested carefully. Please contribute with updates if you have a simpler method. Filtering non-additive data can be challenging, especially because at GitLab we often want to see data from a “final” month only most of the time, but if we are in a non-final month for a quarter or year (such as March), we still want to see the live data for that time period. To further complicate this, if we change our report date to be February, we would not want to show the March data any longer, because then Tableau would add February + March’s numbers together, which would be an error for non-additive data.
The following calculation will circumnavigate those issues.
m/q/y filters for KPI's
m/q/y filters for KPI’s
IF [Select Time Period] = 'quarter' THEN
( [Month Of Fiscal Year] % 3 = 0// last month of quarter
        AND [First Day Of Fiscal Quarter] < [First Day Of Fiscal Quarter (Dim Date1)] // Earlier than this quarter
) // For all previous quarters, it is the last month of the quarter.

    OR ([Fiscal Year] = [Fiscal Year (Dim Date1)] AND [Month Of Fiscal Year] = [Month Of Fiscal Year (Dim Date1)] )
// For this quarter, it is the same month as the report date

ELSEIF
 [Select Time Period] = 'year' THEN
   [Month Of Fiscal Year] = 12 OR (YEAR([Date Actual]) = YEAR([Report Date]) AND [Month Of Fiscal Year] = [Month Of Fiscal Year (Dim Date1)])

ELSEIF [Select Time Period] = 'month' THEN TRUE

END
Then, create another field for your non-additive KPI, such as ARR. Use the following code:
KPI - m/q/y
IF [m/q/y Filters for KPI's]
     THEN [ARR] END
This can be used for every non-additive KPI, which will make creating and maintaing them simpler.
Enabling Year Over Year Table Calculations for a Full Date Range
If you would like to create a table or chart with Period over Period calculations involved, then Tableau will only be able to use the data that is in the view (on the worksheet) to perform those table calculations. For further documentation on table calculations, check here This means that your leading values in the table will not have any data available to them to create the table calculations.
Let’s say you wanted to make a bar chart of Sales, but you wanted to embed the Period over Period information into the tooltips. If you only include one year’s worth of data in the filter, then Tableau will not be able to calculate any year over year calculations, because it cannot “see” the prior year’s data. There are ways to hard code around this, but there is a simple solution that you can use to “trick” Tableau into allowing the period over period calculations you want, at any date granularity.
The solution is to create a date filter that effectively doubles the date range that you are looking for in the workbook, and then use another table calculation to filter out the leading values. Using a second table calculation to show the correct number of time periods in the view will retain the underlying data that Tableau needs to create year over year calculations, while keeping the view looking as intended.
- First, create a dynamic date filter that doubles the date range. Apply this as “True”. There are two options to modify the filter from ealier, you can filter the data to cut off at the day of the report date, or you can filter the data to cut off at the same period as the report date. For example, if you filter the data to cut off at the day of the report date it might stop on November 13th, 2023. However, filtering the data to cut off at the same period as the report date, then if the report date is November 13th and the date granularity is set to quarter, then any data in the dataset for November 1- January 31st will show in the view (with a fiscal year start date in February).
Date Filters
Dynamic Date Filter for PoP (to report date)
IF [Select Time Period] = 'month' THEN (
    DATETRUNC('day',[Date Actual]) <= DATETRUNC('day',[Report Date]) //sooner than the day of report date and
        AND  DATETRUNC('month',[Date Actual]) > DATEADD('month', (-[Date Interval]*2), DATETRUNC('month',[Report Date])) //after the month of the date interval * 2 back in time

    )

ELSEIF [Select Time Period] = 'quarter' THEN
   ( DATETRUNC('day',[Date Actual]) <= DATETRUNC('day',[Report Date]) AND  // earlier than the report date
         DATETRUNC('month',[First Day Of Fiscal Quarter] ) > DATEADD('month', ((-[Date Interval]-4)*3), DATETRUNC('month',[First Day Of Fiscal Quarter (Dim Date1)])) // sooner than the number of quarters back (months *3 because of fiscal quarters)

    )

ELSEIF [Select Time Period] = 'year' THEN
   ( DATETRUNC('day',[Date Actual]) <= DATETRUNC('day',[Report Date]) AND  // earlier than the report date
         [First Day Of Fiscal Year] > DATEADD('month',-[Date Interval]*12,[First Day Of Fiscal Year (Dim Date1)]) // the same year or sooner than the report date * -interval (12mos)

    )

END
Dynamic Date Filter for PoP (total periods)
IF [Select Time Period] = 'month' THEN (
    DATETRUNC('month',[Date Actual]) <= DATETRUNC('month',[Report Date]) //sooner than or = to the month of the report date
        AND  DATETRUNC('month',[Date Actual]) > DATEADD('month', (-[Date Interval]*2), DATETRUNC('month',[Report Date])) //after the month of the date interval * 2 back in time

    )

ELSEIF [Select Time Period] = 'quarter' THEN
   ( [First Day Of Fiscal Quarter] <= [First Day Of Fiscal Quarter (Dim Date1)] AND  // sooner than or = to the quarter of the report dateearlier than the report date
         DATETRUNC('month',[First Day Of Fiscal Quarter] ) > DATEADD('month', ((-[Date Interval]-4)*3), DATETRUNC('month',[First Day Of Fiscal Quarter (Dim Date1)])) // sooner than the number of quarters back (months *3 because of fiscal quarters)

    )

ELSEIF [Select Time Period] = 'year' THEN
   ([First Day Of Fiscal Year] <= [First Day Of Fiscal Year (Dim Date1)] AND // sooner than or = to the year of the report date
         [First Day Of Fiscal Year] > DATEADD('month',-[Date Interval]*12,[First Day Of Fiscal Year (Dim Date1)]) // the same year or sooner than the report date * -interval (12mos)

    )

END
- Next, create the filter that will adjust the view to only show the date range that you selected originally.
View Filter
Don’t Show Leading Values Filter
IF [Select Time Period] = 'quarter' THEN
FIRST() <= -4
ELSEIF [Select Time Period] = 'month' THEN FIRST() <= -12
ELSE FIRST() <= -1
END
- Now you can use table calculations to create each of your date granularities’ table calculations. To allow these to change dynamically based on your selected date granularity, you can use the following calculations, using
Salesas an example KPI.- First create your table calculations to offset by 1 time period, 4 time periods, and 12 time periods:
Time Period Table Calculations
Sales -1
(ZN(SUM([Sales])) - LOOKUP(ZN(SUM([Sales])), -1)) / ABS(LOOKUP(ZN(SUM([Sales])), -1))
Sales -4
(ZN(SUM([Sales])) - LOOKUP(ZN(SUM([Sales])), -4)) / ABS(LOOKUP(ZN(SUM([Sales])), -4))
Sales -12
(ZN(SUM([Sales])) - LOOKUP(ZN(SUM([Sales])), -12)) / ABS(LOOKUP(ZN(SUM([Sales])), -12))
- Now create the Period over Period calculations:
Sales MoM
IF [Select Time Period] = 'month' THEN [Sales -1] END
Sales QoQ
IF [Select Time Period] = 'month' THEN [Sales -4]
ELSEIF [Select Time Period] = 'quarter' THEN [Sales -1]
END
Sales YoY
IF [Select Time Period] = 'month' THEN [Sales -12]
ELSEIF [Select Time Period] = 'quarter' THEN [Sales -4]
ELSEIF [Select Time Period] = 'year' THEN [Sales -1]
END
- As a bonus, if you want to include each of these in a tooltip and be able to include a “month over month” label that disappears when the date granularity is quarter or year, here are the labels you can create labels.
Labels
MoM Label
IF [Select Time Period] = 'month'  THEN ", and the month over month change was: " // "MoM change: "
END
QoQ Label
IF [Select Time Period] = 'month' OR [Select Time Period] = 'quarter' THEN ", the quarter over quarter change was: " // "QoQ Change: "
END
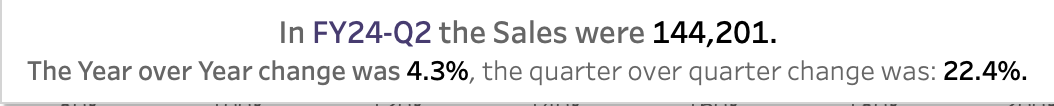
- To put those together, the tooltip would have the following code, centered and formatted:
In <Axis Dates> the Sales were <SUM(Sales)>.
The Year over Year change was <AGG(Sales YoY)><ATTR(QoQ Label)><AGG(Sales QoQ)><ATTR(MoM label)><AGG(Sales MoM)>.
The output of this tooltip would look like this: 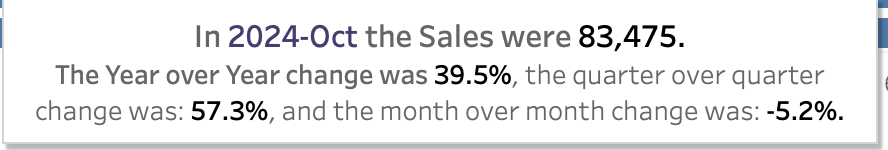
Design Tips
Some additional design tips that may help your workbook creation efficency.
Add GitLab Colors
You can add a color palette to Tableau Desktop so that any time you need to choose colors for your visualizations, you have access to GitLab’s colors in the color menu. Find more instructions here
46417d02)
