Capacity planning for GitLab Dedicated
| Status | Authors | Coach | DRIs | Owning Stage | Created |
|---|---|---|---|---|---|
| implemented |
abrandl
|
andrewn
|
swiskow
lmcandrew
o-lluch
|
2023-09-11 |
Summary
This document outlines how we plan to set up infrastructure capacity planning for GitLab Dedicated tenant environments, which started as a FY24-Q3 OKR.
We make use of Tamland, a tool we build to provide saturation forecasting insights for GitLab.com infrastructure resources. We propose to include Tamland as a part of the GitLab Dedicated stack and execute forecasting from within the tenant environments.
Tamland predicts SLO violations and their respective dates, which need to be reviewed and acted upon. In terms of team organisation, the Dedicated team is proposed to own the tenant-side setup for Tamland and to own the predicted SLO violations, with the help and guidance of the Scalability::Observability team, which drives further development, documentation and overall guidance for capacity planning, including for Dedicated.
With this setup, we aim to turn Tamland into a more generic tool, which can be used in various environments including but not limited to Dedicated tenants. Long-term, we think of including Tamland in self-managed installations and think of Tamland as a candidate for open source release.
Motivation
Background: Capacity planning for GitLab.com
Tamland is an infrastructure resource forecasting project owned by the Observability team. It implements capacity planning for GitLab.com, which is a controlled activity covered by SOC 2. As of today, it is used exclusively for GitLab.com to predict upcoming SLO violations across hundreds of monitored infrastructure components.
Tamland produces a report (internal link, hosted on GitLab Pages) containing forecast plots, information around predicted violations and other information around the components monitored. Any predicted SLO violation results in a capacity warning issue being created in the issue tracker for capacity planning on GitLab.com.
At present, Tamland is quite tailor made and specific for GitLab.com:
- GitLab.com specific parameters and assumptions are built into Tamland
- We execute Tamland from a single CI project, exclusively for GitLab.com
Turning Tamland into a tool we can use more generically and making it independent of GitLab.com specifics is subject of ongoing work.
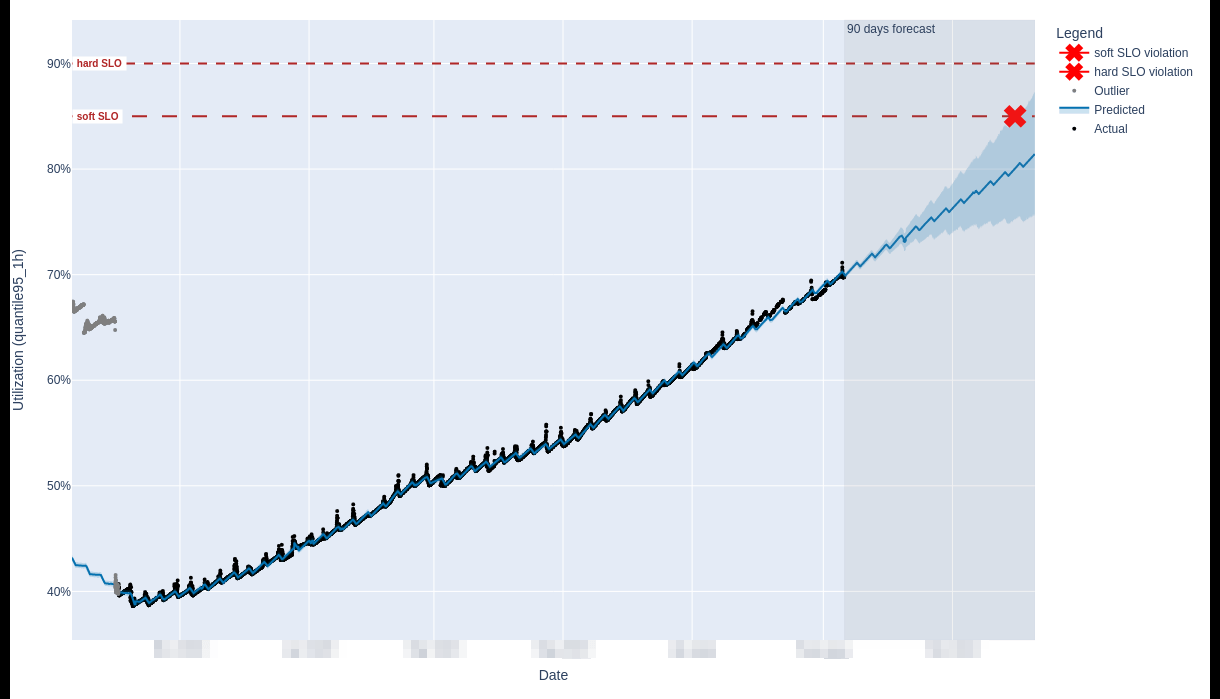
For illustration, we can see a saturation forecast plot below for the disk_space resource for a PostgreSQL service called patroni-ci.
Within the 90 days forecast horizon, we predict a violation of the soft SLO (set at 85% saturation) and this resulted in the creation of a capacity planning issue for further review and potential actions.
At present, the Scalability::Observability group reviews those issues and engages with the respective DRI for the service in question to remedy a saturation concern.

For GitLab.com capacity planning, we operate Tamland from a scheduled CI pipeline with access to the central Mimir, which provides saturation and utilization metrics for GitLab.com. The CI pipeline produces the desired report, exposes it on GitLab Pages and also creates capacity planning issues. Scalability::Observability runs a capacity planning triage rotation which entails reviewing and prioritizing any open issues and their respective saturation concerns.
Problem Statement
With the number of GitLab Dedicated deployments increasing, we need to establish capacity planning processes for Dedicated tenants. This is going to help us notice any pending resource constraints soon enough to be able to upgrade the infrastructure for a given tenant before the resource saturates and causes an incident.
Each Dedicated tenant is an isolated GitLab environment, with a full set of metrics monitored. These metrics are standardized in the metrics catalog and on top of these, we have defined saturation metrics along with respective SLOs.
In order to provide capacity planning and forecasts for saturation metrics for each tenant, we’d like to get Tamland set up for GitLab Dedicated.
While Tamland is developed by the Scalability::Observability and this team also owns the capacity planning process for GitLab.com, they don’t have access to any of the Dedicated infrastructure as we have strong isolation implemented for Dedicated environments. As such, the technical design choices are going to affect how those teams interact and vice versa. We include this consideration into this documentation as we think the organisational aspect is a crucial part of it.
Key questions
- How does Tamland access Prometheus data for each tenant?
- Where does Tamland execute and how do we scale that?
- Where do we store resulting forecasting data?
- How do we consume the forecasts?
Goals: Iteration 0
- Tamland is flexible enough to forecast saturation events for a Dedicated tenant and for GitLab.com separately
- Forecasting is executed at least weekly, for each Dedicated tenant
- Tamland’s output is forecasting data only (plots, SLO violation dates, etc. - no report, no issue management - see below)
- Tamland stores the output data in a S3 bucket for further inspection
Goals: Iteration 1
In Iteration 0, we’ve integrated Tamland into GitLab Dedicated environments and started to generate forecasting data for each tenant regularly.
In order to consume this data and make it actionable, this iteration is about providing reporting functionality for GitLab Dedicated: We generate a GitLab Pages deployed static site that contains individual Tamland reports for all tenants.
We use the default Tamland report to generate the per-tenant report. In a future iteration, we may want to provide another type of report specifically tailored for GitLab Dedicated needs.
Goals: Iteration 2
In order to raise awareness for a predicted SLO violation, Tamland has functionality to manage a GitLab issue tracker and create an issue for a capacity warning.
We use this, for example, to manage capacity warnings for GitLab.com using the gitlab-com capacity planning tracker.
For GitLab Dedicated tenants, we suggest to use the gitlab-dedicated capacity planning tracker in a similar fashion:
For each predicted SLO violation with reasonable confidence, we create a capacity warning issue on this tracker and use a scoped label to distinguish warnings for different tenants (see below for more details).
Non-goals
Customizing forecasting models
Forecasting models can and should be tuned and informed with domain knowledge to produce accurate forecasts. This information is a part of the Tamland manifest. In the first iteration, we don’t support per-tenant customization, but this can be added later.
Proposed Design for Dedicated: A part of the Dedicated stack
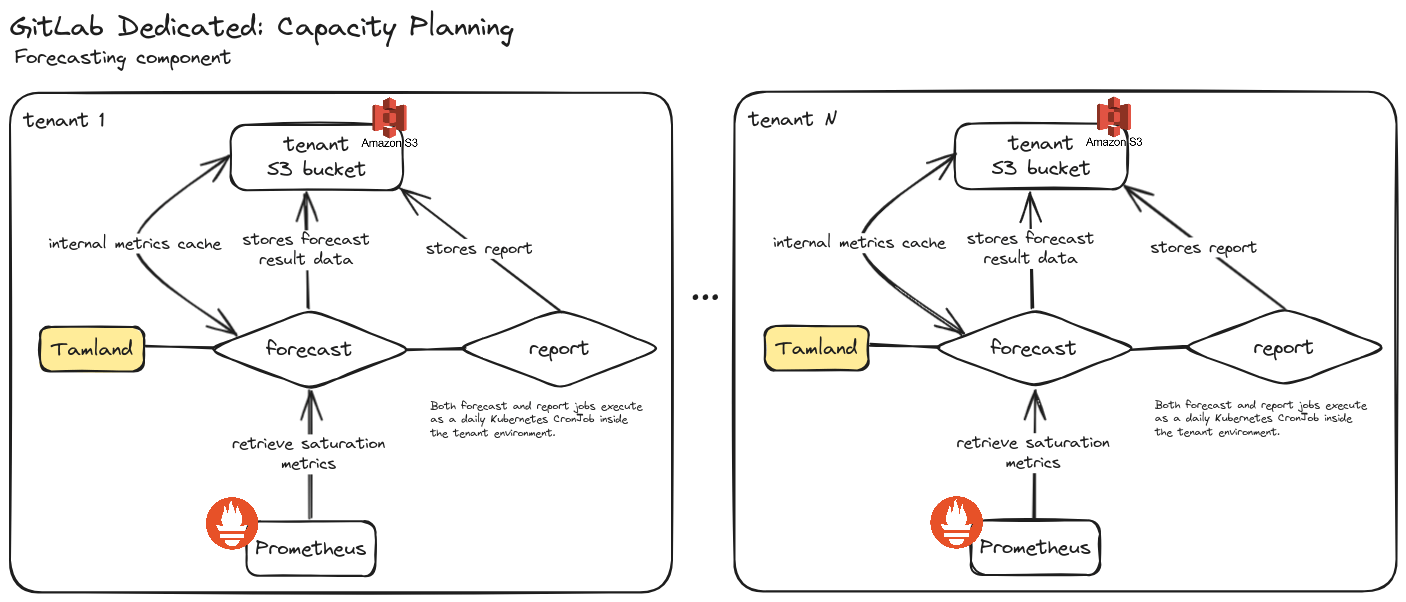
Dedicated environments are fully isolated and run their own Prometheus instance to capture metrics, including saturation metrics. Tamland will run from each individual Dedicated tenant environment, consume metrics from Prometheus and store the resulting data in S3. From there, we consume forecast data and act on it.

Generating forecasts
Storage for output and cache
Any data Tamland relies on is stored in a S3 bucket. We use one bucket per tenant to clearly separate data between tenants.
- Resulting forecast data and other outputs
- Tamland’s internal cache for Prometheus metrics data
There is no need for a persistent state across Tamland runs aside from the S3 bucket.
Benefits of executing inside tenant environments
Each Tamland run for a single environment (tenant) can take a few hours to execute. With the number of tenants expected to increase significantly, we need to consider scaling the execution environment for Tamland.
In this design, Tamland becomes a part of the Dedicated stack and a component of the individual tenant environment. As such, scaling the execution environment for Tamland is solved by design, because tenant forecasts execute inherently parallel in their respective environments.
Distribution model: Docker + Helm chart
Tamland is released as a Docker image along with a Helm chart, see Tamland’s README for further details.
Tamland Manifest
The manifest contains information about which saturation metrics to forecast on (see this manifest example for GitLab.com). This will be generated from the metrics catalog and will be the same for all tenants for starters.
In order to generate the manifest from the metrics catalog, we setup dedicated GitLab project tamland-dedicated.
On a regular basis, a scheduled pipeline grabs the metrics catalog, generates the JSON manifest from it and commits this to the project.
On the Dedicated tenants, we download the latest version of the committed JSON manifest from tamland-dedicated and use this as input to execute Tamland.
Capacity planning reports and Capacity Warnings
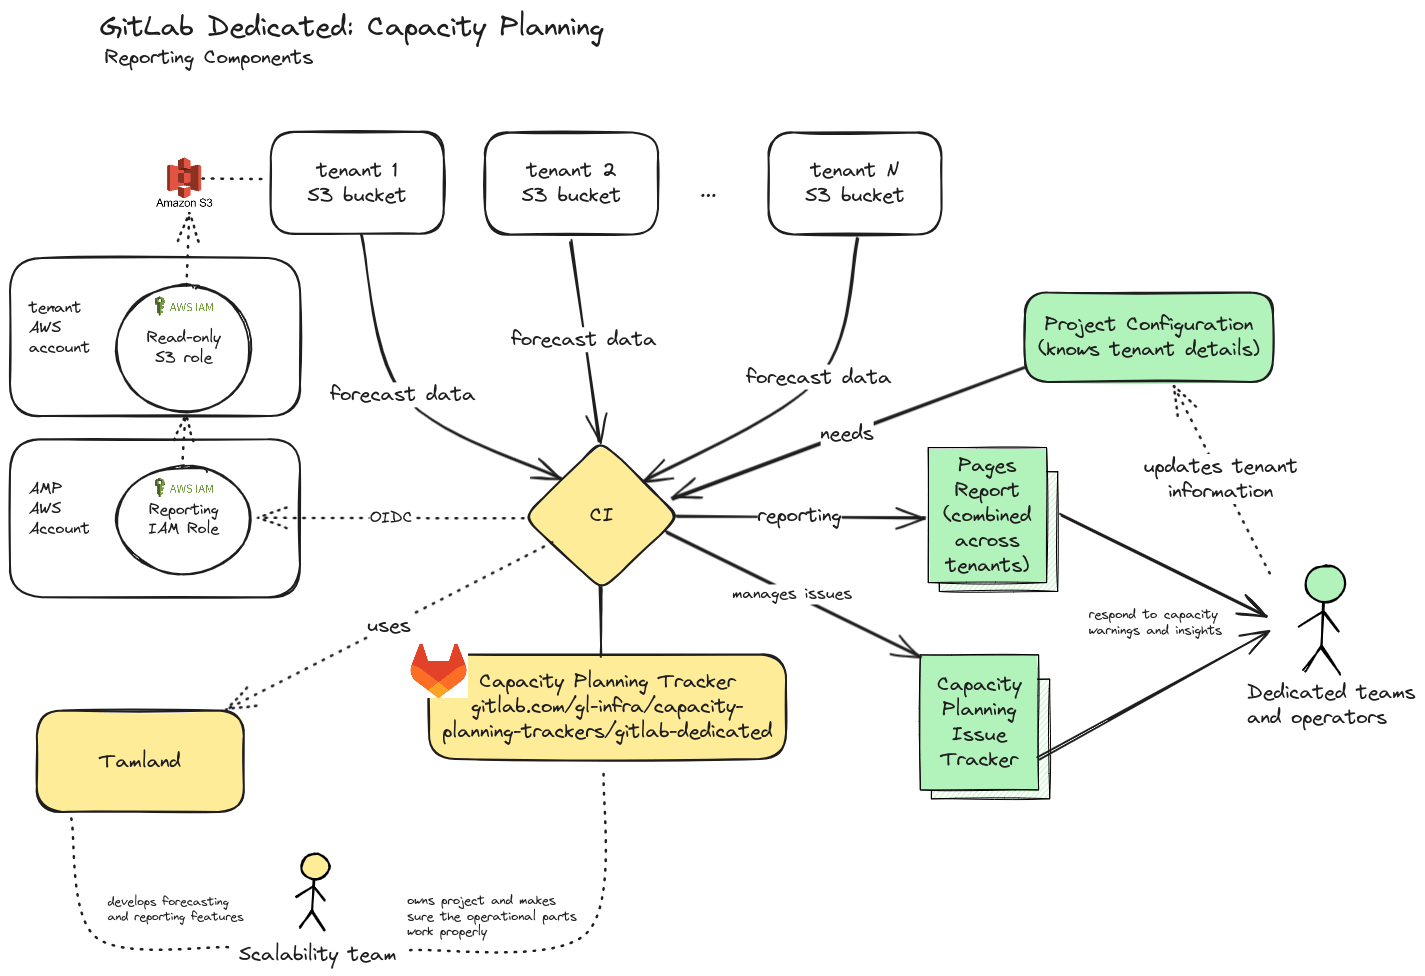
Based on Tamland’s forecasting data, we generate reports to display forecasting information and enable teams to act on capacity warnings by creating capacity warnings in a GitLab issue tracker.

The Scalability::Observability team maintains an internal GitLab project called gitlab-dedicated.
This project contains a scheduled CI pipeline to regularly produce a static site deployed to GitLab Pages (only available internally).
It also contains functionality to create and manage capacity warnings in the issue tracker of this project.
CI configuration for this project contains a list of tenants along with their respective metadata (e.g. AWS account, codename, etc.).
For each configured tenant, the CI pipeline uses a central IAM role in the amp account. With this role, a tenant-specific IAM role can be assumed, which has read-only access to the respective S3 bucket containing the tenant’s forecasting data.
The CI pipeline produces a standard Tamland report for each tenant and integrates all individual reports into a single static site. This site provides unified access to capacity forecasting insights across tenant environments.
Along with the report, the CI pipeline also reacts to predicted SLO violations and creates a capacity warning issue in the project’s issue tracker.
As the tracker is being used for all GitLab Dedicated tenants, we employ a ~tenant:CN label to distinguish tenant environments (e.g. we use ~tenant:C1 for the tenant with codename C1).
These issues contain further information about the tenant and component affected, along with forecasts and status information.
The intention here is to create visibility into predicted SLO violations and provide a way for the Dedicated team to engage with capacity warnings directly (e.g. for discussion, work scheduling etc.).
Overall, the Dedicated teams and operators use the Tamland report and issue tracker to act on capacity warnings.
In order to get started, we suggest the Dedicated group to take a regular pass across the capacity warnings and triage those. For additional visibility, we may want to consider enabling getting Slack updates sent out for new capacity warnings created.
Alternative Solution
Tamland as a Service (not chosen)
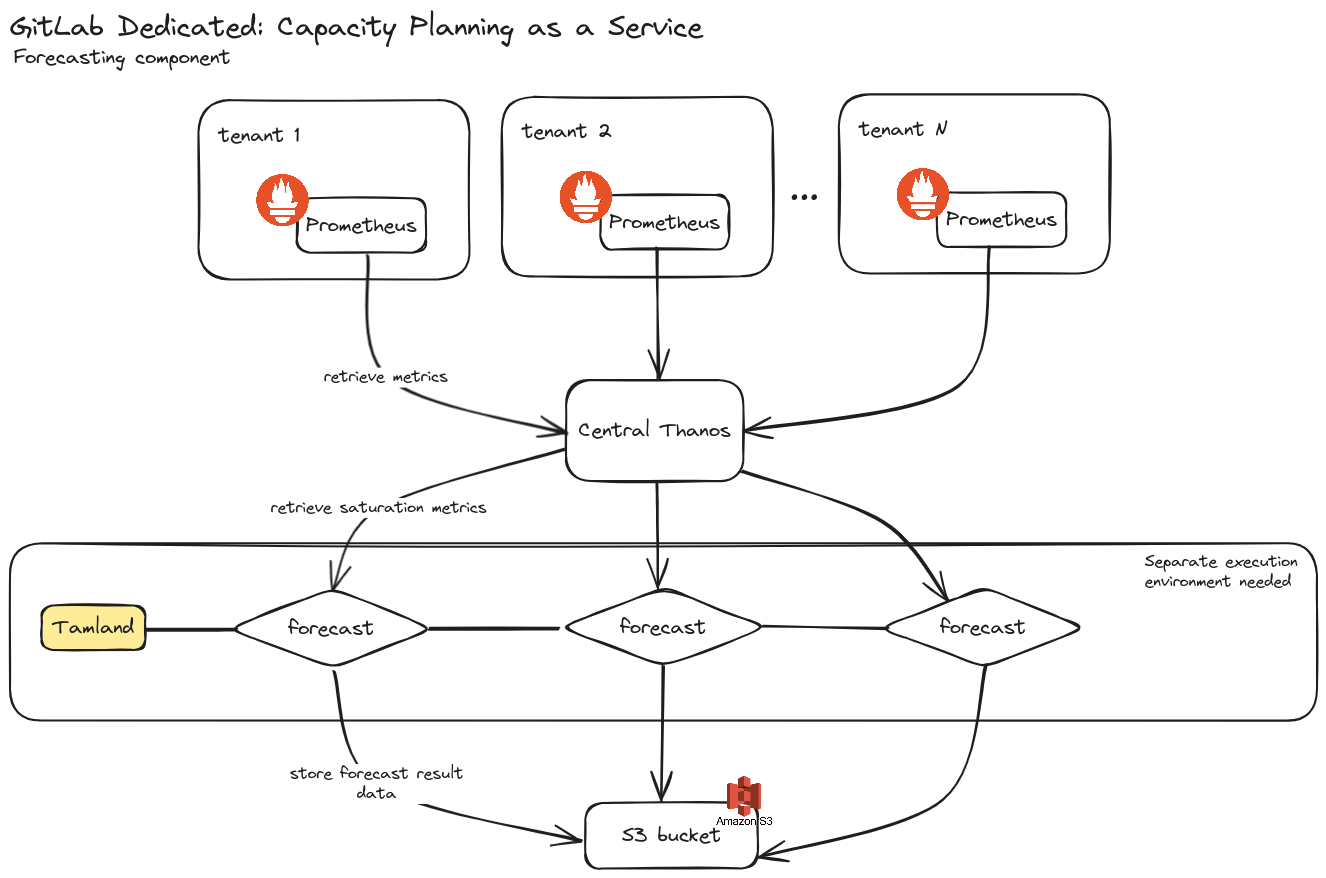
An alternative design, we don’t consider an option at this point, is to set up Tamland as a Service and run it fully outside of tenant environments.

In this design, a central Prometheus/Mimir instance is needed to provide the metrics data for Tamland. Dedicated tenants use remote-write to push their Prometheus data to the central Mimir instance.
Tamland is set up to run on a regular basis and consume metrics data from the single Mimir instance. It stores its results and cache in S3, similar to the other design.
In order to execute forecasts regularly, we need to provide an execution environment to run Tamland in. With an increasing number of tenants, we’d need to scale up resources for this cluster.
This design has not been chosen because of both technical and organisational concerns:
- Our central Mimir instance currently doesn’t have metrics data for Dedicated tenants as of the start of FY24Q3.
- Extra work required to set up scalable execution environment.
- Mimir is considered a bottleneck as it provides data for all tenants and this poses a risk of overloading it when we execute the forecasting for a high number of tenants.
- We strive to build out Tamland into a tool of more general use. We expect a better outcome in terms of design, documentation and process efficiency by building it as a tool for other teams to use and not offering it as a service. In the long run, we might be able to integrate Tamland (as a tool) inside self-managed environments or publish Tamland as an open source forecasting tool. This would not be feasible if we were hosting it as a service.
b7b8c1f1)
